San Antonio, Texas Commercial Real Estate Market Report
As of September 2026 · 244 active listings tracked on Commrty
- Active listings
- 244
- For sale
- 244
- Median asking price
- $974K
- Avg. advertised cap rate
- 6.63%
- New in last 30 days
- 0
- Retail92 · 38%
- Land54 · 22%
- Office34 · 14%
- Multifamily25 · 10%
- Industrial19 · 8%
- Mixed Use7 · 3%
- Hospitality5 · 2%
- Business for Sale3 · 1%
Based on 132 listings that publish an asking price.
- New in last 30 days0
- New in last 90 days244
- Sold or leased (180 days)2
Market analysis — September 2026
The San Antonio commercial real estate market currently features 244 active sale listings on Commrty. These listings represent the entirety of the platform's current inventory for the region, with all 244 entries categorized as properties for sale rather than lease. This volume of inventory has been established through 244 listings added within the last 90 days, while no new listings have been added to the platform in the last 30 days. Market activity remains selective, as evidenced by only 2 properties being marked as sold or leased during the last 180 days across the platform database. Pricing across the San Antonio market shows a wide range for investors. Among the 132 listings that publicly disclose asking prices, valuations span from $31,000 at the lower end to $17,000,000 for larger assets, resulting in a median asking price of $974,000. For those evaluating potential returns on these active listings, the median advertised cap rate stands at 6.63 percent. This pricing structure offers a diverse entry point for buyers ranging from small-scale private investors to those seeking larger institutional or commercial assets within this major Texas economic hub. The asset composition on Commrty is heavily weighted toward retail and land development opportunities. Retail accounts for 92 of the active listings, followed by 54 listings for land, 34 for office space, and 25 for multifamily properties. Industrial, mixed-use, hospitality, and business-for-sale assets comprise the remainder of the inventory. This variety supports a broad spectrum of commercial interests, whether for operators looking to establish a presence in the region’s diverse economy or investors targeting long-term land development or income-producing commercial assets within the San Antonio metropolitan area.
Figures are computed from active listings published on Commrty as of September 2026 and describe listed inventory, not the entire market. Analysis is generated from those figures and refreshed monthly.
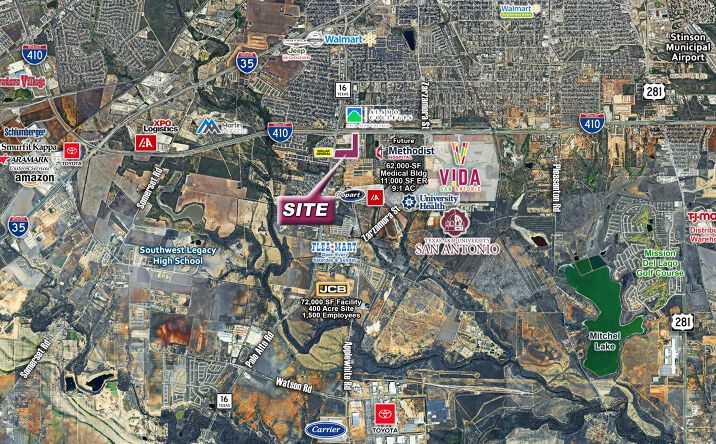
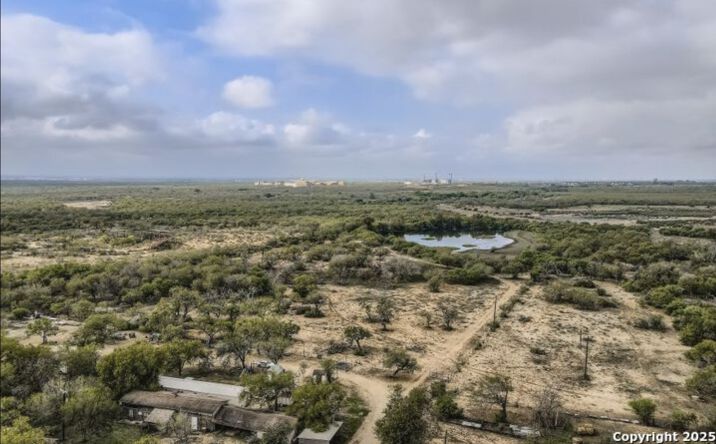
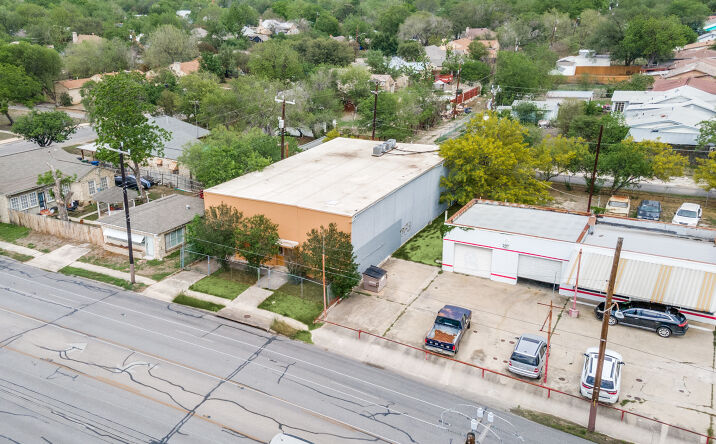
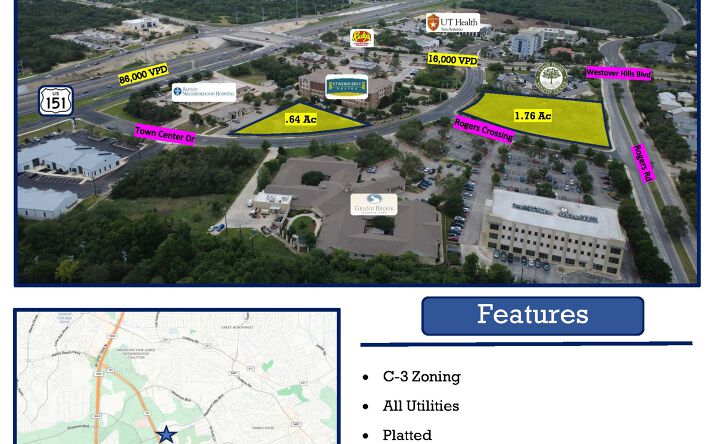
Featured San Antonio listings
 📍
📍 📍
📍 📍
📍 📍
📍 📍
📍 📍
📍