Fort Worth, Texas Commercial Real Estate Market Report
As of September 2026 · 166 active listings tracked on Commrty
- Active listings
- 166
- For sale
- 166
- Median asking price
- $1.1M
- Avg. advertised cap rate
- 6.36%
- New in last 30 days
- 0
- Retail61 · 37%
- Land43 · 26%
- Office25 · 15%
- Industrial20 · 12%
- Multifamily10 · 6%
- Hospitality5 · 3%
- Business for Sale1 · 1%
- Special Purpose1 · 1%
Based on 75 listings that publish an asking price.
- New in last 30 days0
- New in last 90 days166
- Sold or leased (180 days)0
Market analysis — September 2026
The current Commrty marketplace for Fort Worth features a total of 166 active listings, all of which are offered for sale. This inventory represents a concentration of properties available for acquisition, with all 166 listings having been added within the last 90 days. No new listings were introduced during the last 30 days, reflecting a stable pool of assets currently available to potential investors seeking exposure to this North Texas market, which is characterized by its diversified economic base spanning energy, aviation, and logistics sectors. Property valuations across these listings show a wide range, starting at 190,000 dollars and reaching up to 20 million dollars. Among the 75 listings that publicly disclose an asking price, the median price sits at 1.1 million dollars. The median advertised cap rate for these assets is 6.36 percent. These figures provide a baseline for assessing current pricing expectations for buyers and sellers operating within the Fort Worth commercial landscape. The inventory composition is diverse, led by 61 retail properties and 43 land parcels. Other segments include 25 office assets, 20 industrial properties, 10 multifamily buildings, and five hospitality assets. This distribution offers a variety of entry points for different investor profiles, from developers interested in raw land to operators targeting established retail or industrial facilities. The absence of leasing activity within this specific dataset suggests the current focus for users on this platform is primarily on ownership and capital deployment rather than leasehold interests.
Figures are computed from active listings published on Commrty as of September 2026 and describe listed inventory, not the entire market. Analysis is generated from those figures and refreshed monthly.
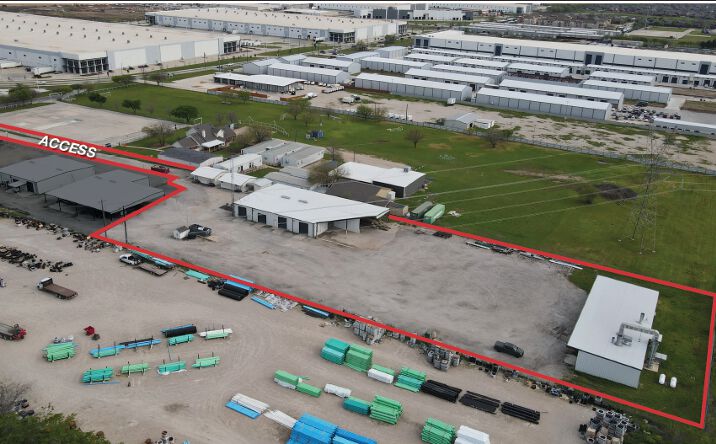
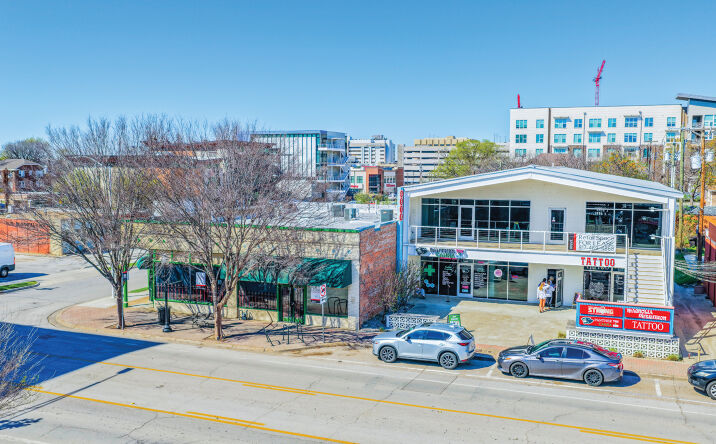
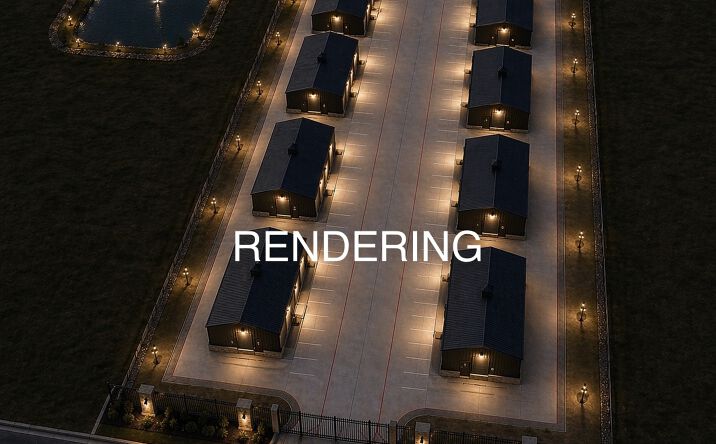
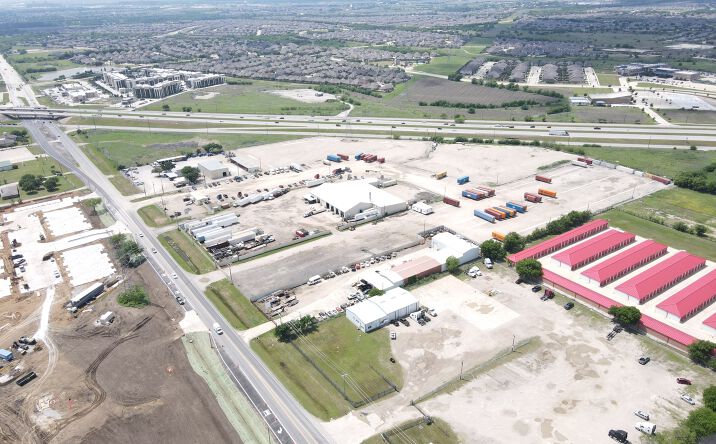
Featured Fort Worth listings
 📍
📍 📍
📍 📍
📍 📍
📍 📍
📍