Dallas, Texas Commercial Real Estate Market Report
As of September 2026 · 165 active listings tracked on Commrty
- Active listings
- 165
- For sale
- 165
- Median asking price
- $1.5M
- Avg. advertised cap rate
- 6.00%
- New in last 30 days
- 0
- Retail58 · 35%
- Land38 · 23%
- Multifamily25 · 15%
- Industrial20 · 12%
- Office11 · 7%
- Mixed Use5 · 3%
- Business for Sale3 · 2%
- Hospitality2 · 1%
Based on 84 listings that publish an asking price.
- New in last 30 days0
- New in last 90 days165
- Sold or leased (180 days)9
Market analysis — September 2026
The Dallas commercial real estate market presents a diverse range of opportunities as reflected in the current inventory of 165 active sale listings on Commrty. These listings represent all new additions to the platform within the last 90 days, with no new entries recorded in the final 30-day window. The marketplace exhibits a broad spectrum of commercial properties, showcasing the significant scale and economic depth characteristic of the North Texas region. Investors and developers utilizing the platform have a consolidated view of these available assets, which have entered the market through recent listing activity. Pricing for these active listings spans from 90,000 dollars to 16 million dollars, with a median asking price of 1.5 million dollars among the 84 listings that publicly disclose their value. The median advertised cap rate across these opportunities stands at 6.00 percent. These financial metrics provide a baseline for evaluating investment potential within the current Dallas landscape. Prospective buyers can use these figures to gauge how current valuations align with their internal investment thresholds and risk profiles when assessing assets listed specifically on the Commrty platform. The inventory composition is heavily weighted toward retail and land, which account for 58 and 38 listings respectively. Multifamily assets follow with 25 listings, while industrial and office properties comprise 20 and 11 listings each. The remainder consists of mixed-use, business for sale, and hospitality assets. This distribution supports a variety of investment strategies ranging from ground-up development on vacant land to the acquisition of stabilized retail spaces. The presence of specialized asset classes allows market participants to tailor their search based on the specific operational requirements and sector focus of their current portfolios.
Figures are computed from active listings published on Commrty as of September 2026 and describe listed inventory, not the entire market. Analysis is generated from those figures and refreshed monthly.
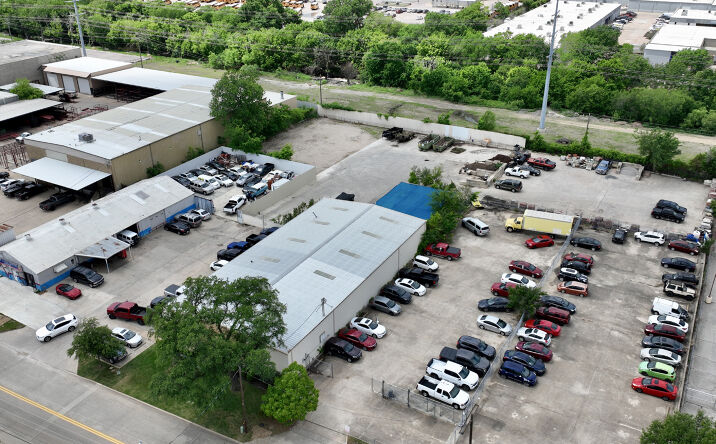
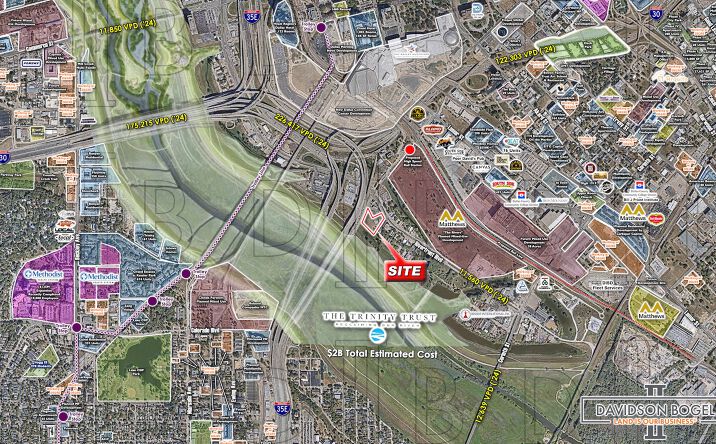
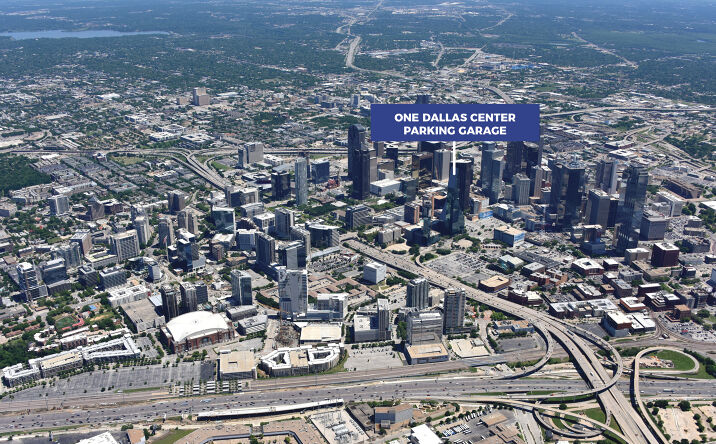
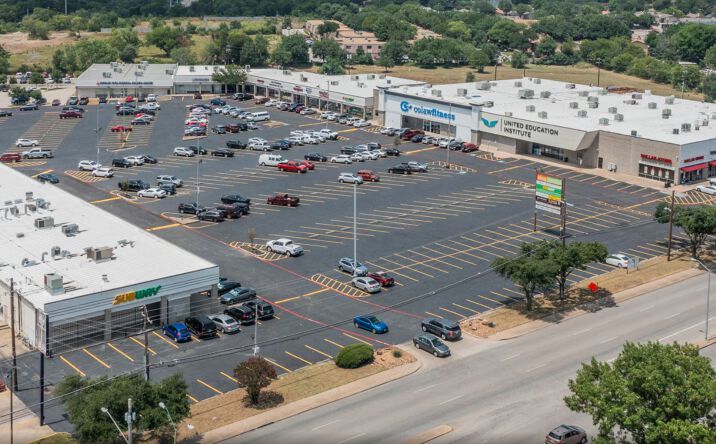
Featured Dallas listings
 📍
📍 📍
📍 📍
📍 📍
📍 📍
📍