Philadelphia, Pennsylvania Commercial Real Estate Market Report
As of September 2026 · 152 active listings tracked on Commrty
- Active listings
- 152
- For sale
- 152
- Median asking price
- $1.2M
- Avg. advertised cap rate
- 7.26%
- New in last 30 days
- 0
- Multifamily64 · 42%
- Retail38 · 25%
- Mixed Use12 · 8%
- Industrial11 · 7%
- Land10 · 7%
- Office8 · 5%
- Special Purpose8 · 5%
- Hospitality1 · 1%
Based on 121 listings that publish an asking price.
- New in last 30 days0
- New in last 90 days152
- Sold or leased (180 days)0
Market analysis — September 2026
The Philadelphia commercial real estate market currently features 152 active listings available for sale on Commrty. These properties entered the marketplace within the last 90 days, reflecting the current inventory volume. All active listings are currently designated for sale, with no properties listed for lease on the platform at this time. The inventory reflects a broad spectrum of commercial opportunities across the metropolitan area, which remains defined by its diverse economic base, significant academic institutions, and established transportation infrastructure connecting the city to the wider Northeast corridor. This supply represents the total pool of active sale options available to participants on the platform. Among the 121 listings that publish a price, asking values range from $70,000 to $20,000,000. The median asking price for these properties stands at $1,200,000. For investors evaluating potential returns, the median advertised cap rate for these listings is 7.26%. These figures provide a baseline for understanding current pricing expectations and income potential for assets listed on Commrty. Buyers should assess these cap rates against their specific investment requirements and the risk profiles associated with the diverse asset types found across the regional market. The portfolio of listings on Commrty is heavily weighted toward multifamily properties, which account for 64 of the total active units. Retail properties represent a significant portion of the remaining inventory with 38 listings, followed by 12 mixed-use sites and 11 industrial facilities. Smaller segments include land, office space, special purpose buildings, and a single hospitality asset. This distribution suggests a market suited for investors focusing on residential density and local retail services, though the smaller categories provide niche options for developers or owner-occupiers seeking specific functional properties within the Philadelphia area.
Figures are computed from active listings published on Commrty as of September 2026 and describe listed inventory, not the entire market. Analysis is generated from those figures and refreshed monthly.
Featured Philadelphia listings
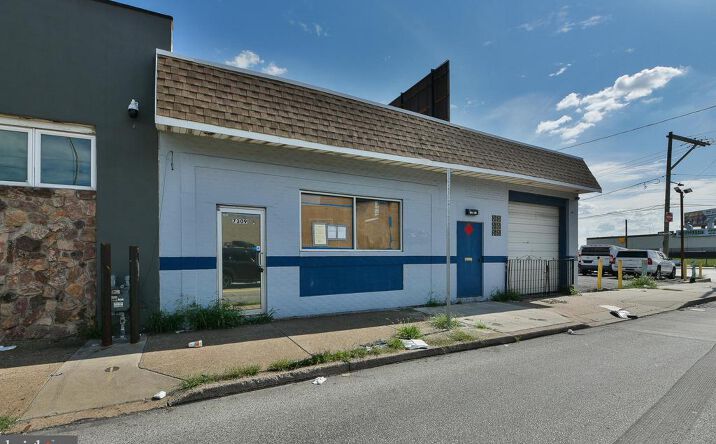 📍
📍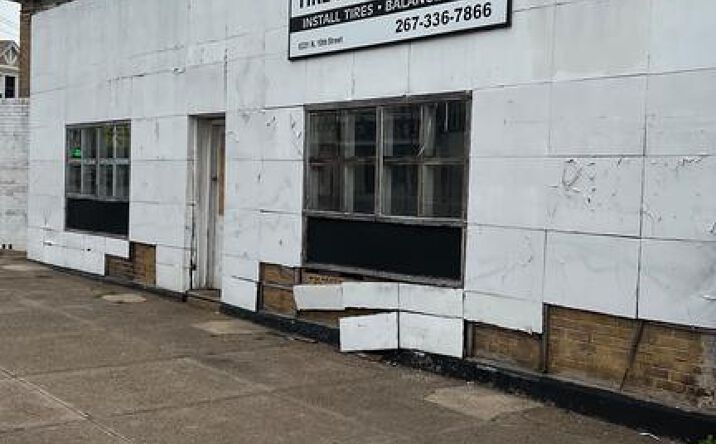 📍
📍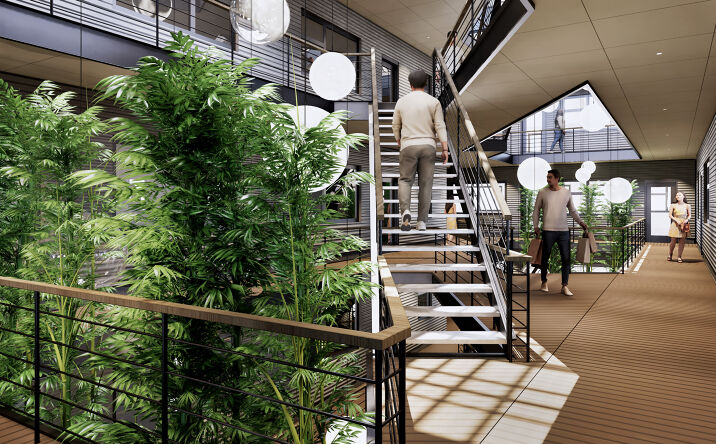 📍
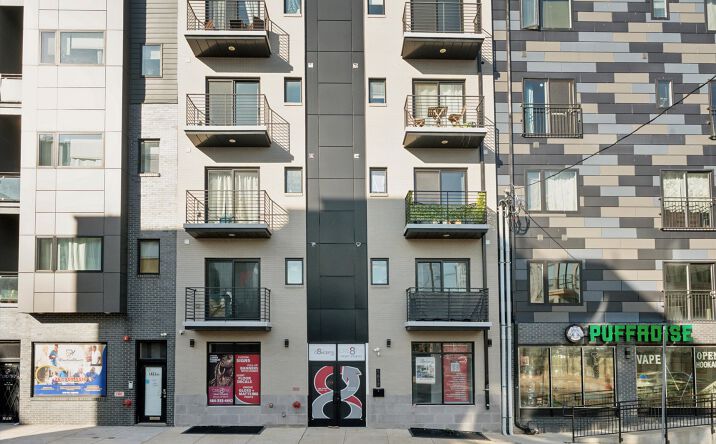
📍
 📍
📍