Oklahoma City, Oklahoma Commercial Real Estate Market Report
As of September 2026 · 114 active listings tracked on Commrty
- Active listings
- 114
- For sale
- 114
- Median asking price
- $1.1M
- Avg. advertised cap rate
- 7.25%
- New in last 30 days
- 0
- Land28 · 25%
- Retail27 · 24%
- Industrial26 · 23%
- Office17 · 15%
- Multifamily9 · 8%
- Business for Sale2 · 2%
- Mixed Use2 · 2%
- Special Purpose2 · 2%
Based on 88 listings that publish an asking price.
- New in last 30 days0
- New in last 90 days114
- Sold or leased (180 days)0
Market analysis — September 2026
The Oklahoma City commercial real estate market presents a diverse range of active opportunities for prospective investors. Currently, there are 114 active listings on the Commrty platform, all of which are offered for sale. This inventory reflects a broad spectrum of asset classes, indicating a wide range of options for those seeking to deploy capital within the regional economy. All 114 of these properties were introduced to the marketplace within the last 90 days, providing a fresh snapshot of available inventory for buyers evaluating the local commercial landscape as of September 2026. Pricing for these assets displays significant variety across the Oklahoma City market. Among the 88 listings that currently publish an asking price, valuations range from $48,000 to $24,000,000, with a median price point of $1,100,000. Investors looking for income-generating potential can observe a median advertised cap rate of 7.25% across the available properties. This range allows participants to assess potential returns relative to their individual investment criteria and risk profiles, while also providing a clear baseline for current market expectations within this specific collection of active listings. The composition of the inventory is led by land parcels and retail assets, which account for 28 and 27 listings respectively. Industrial properties represent a significant portion of the platform at 26 listings, alongside 17 office properties and 9 multifamily assets. Smaller categories include mixed-use, special purpose, and business-for-sale listings. This mix supports diverse business models, ranging from ground-up development on raw land to the acquisition of stabilized retail or industrial facilities. These properties are well-suited for buyers looking to tap into the local economy, which remains anchored by major regional industries such as energy and manufacturing.
Figures are computed from active listings published on Commrty as of September 2026 and describe listed inventory, not the entire market. Analysis is generated from those figures and refreshed monthly.
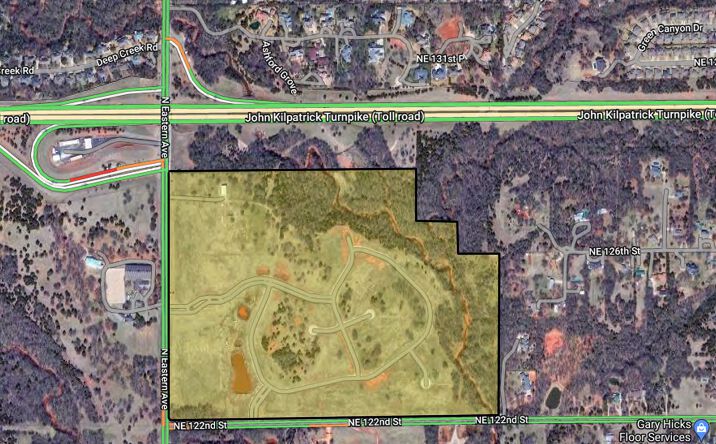
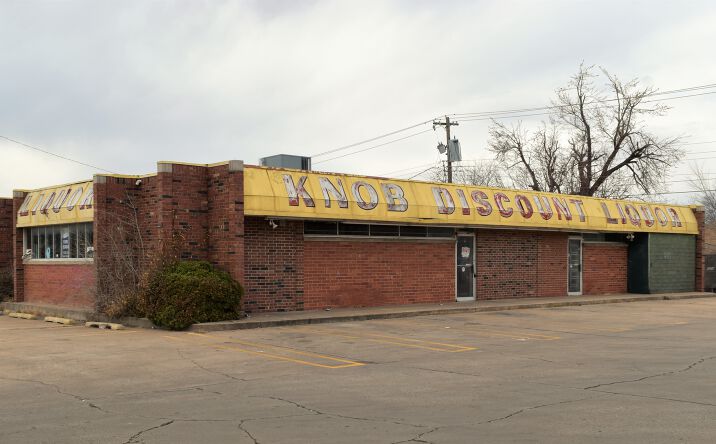
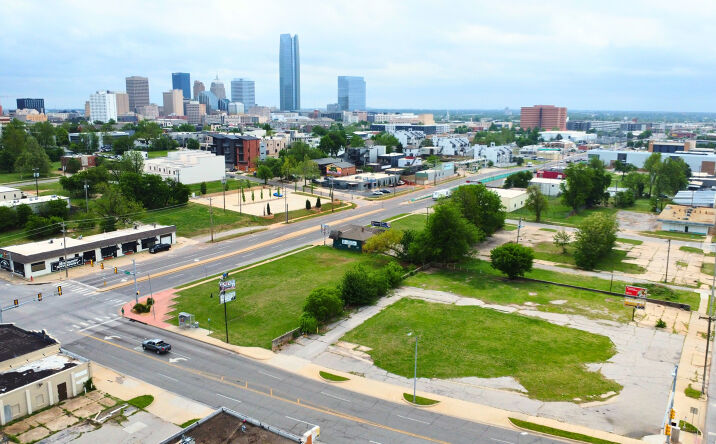
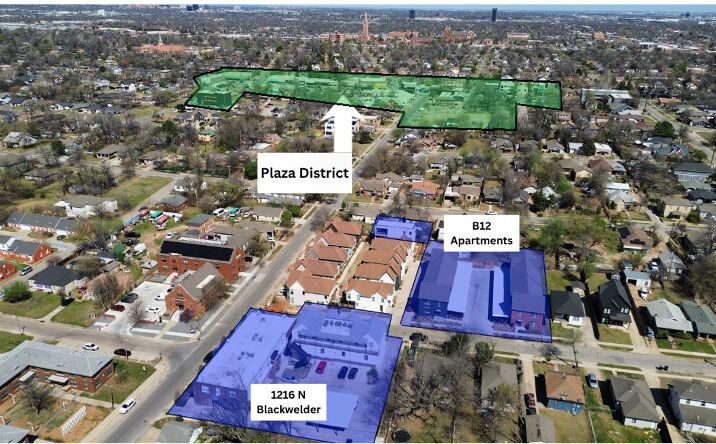
Featured Oklahoma City listings
 📍
📍 📍
📍 📍
📍
 📍
📍