Oxford, Ohio Commercial Real Estate Market Report
As of September 2026 · 177 active listings tracked on Commrty
- Active listings
- 177
- For sale
- 177
- Median asking price
- $669K
- New in last 30 days
- 0
- Multifamily147 · 83%
- Land19 · 11%
- Retail6 · 3%
- Business for Sale2 · 1%
- Industrial1 · 1%
- Office1 · 1%
- Special Purpose1 · 1%
Based on 15 listings that publish an asking price.
- New in last 30 days0
- New in last 90 days177
- Sold or leased (180 days)0
Market analysis — September 2026
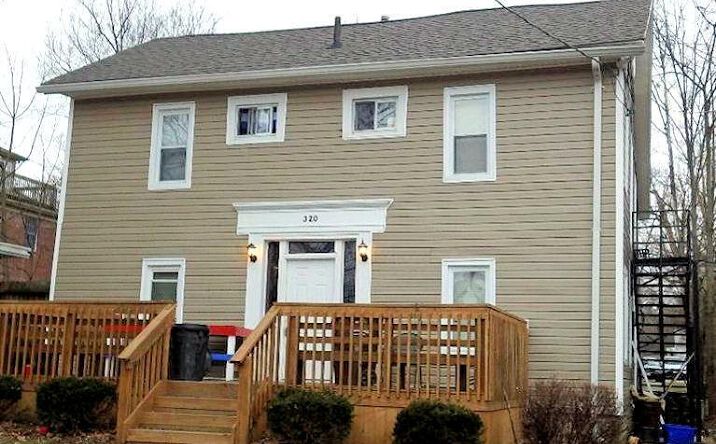
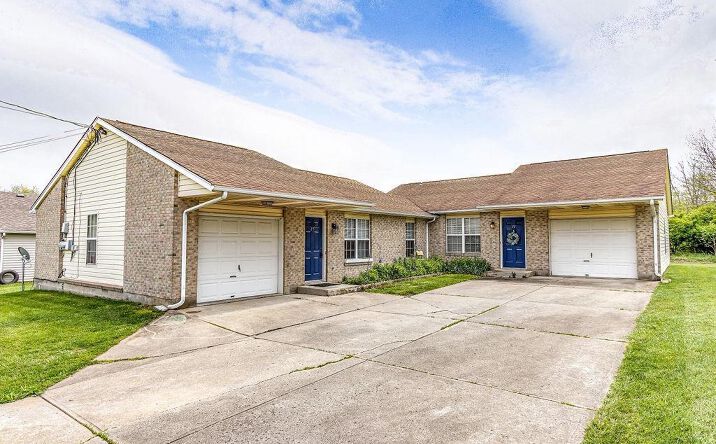
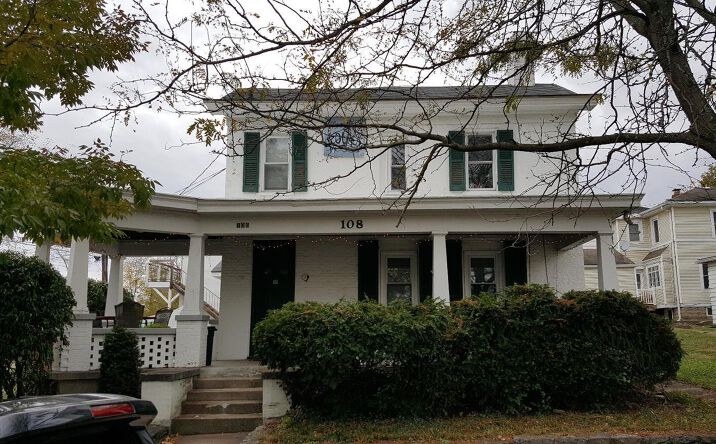
The commercial real estate landscape in Oxford, Ohio currently presents 177 active listings on Commrty, all of which are offered for sale. This entire inventory of 177 listings has been added to the platform within the last 90 days, while no new listings were recorded in the most recent 30-day period. Currently, there is no activity regarding completed sales or leases within the last 180 days on the platform. Prospective buyers can observe the current scale of available property options across the region through these active listings, which reflect the entirety of the current Commrty data set for this market. Regarding valuation, 15 of the active listings provide published asking prices, which range from $199,000 to $6.4 million. The median asking price for these priced assets stands at $669,000. These figures offer a reference point for current seller expectations for those evaluating the Oxford market, though the data reflects only a portion of the total available inventory. Buyers should note that while these price points provide a starting metric, the broader inventory available for sale encompasses a diverse range of property types beyond those with publicly disclosed asking prices. Multifamily properties dominate the Oxford inventory with 147 active listings, all of which are listed for sale rather than lease. The remaining available properties include 19 listings for land, 6 retail locations, 2 businesses for sale, and single listings each for industrial, office, and special purpose assets. This distribution indicates a market heavily skewed toward residential investment opportunities, likely reflecting the presence of the local university and its influence on student housing needs. Investors looking for commercial or specialized facilities will find a more limited selection compared to the primary focus on multifamily holdings.
Figures are computed from active listings published on Commrty as of September 2026 and describe listed inventory, not the entire market. Analysis is generated from those figures and refreshed monthly.
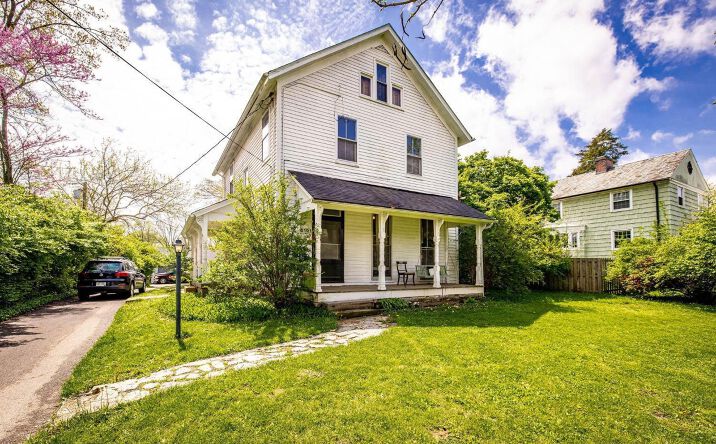
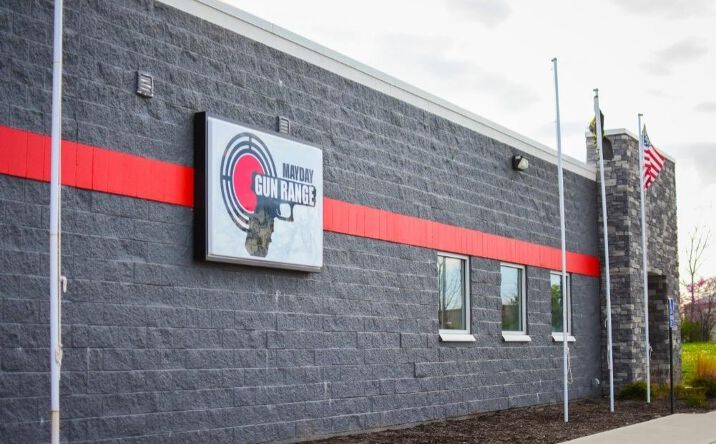
Featured Oxford listings
 📍
📍 📍
📍 📍
📍 📍
📍 📍
📍 📍
📍