Fairfield, Ohio Commercial Real Estate Market Report
As of September 2026 · 170 active listings tracked on Commrty
- Active listings
- 170
- For sale
- 170
- Median asking price
- $1.6M
- Avg. advertised cap rate
- 6.30%
- New in last 30 days
- 0
- Office57 · 34%
- Land40 · 24%
- Multifamily39 · 23%
- Retail14 · 8%
- Business for Sale10 · 6%
- Industrial10 · 6%
Based on 13 listings that publish an asking price.
- New in last 30 days0
- New in last 90 days170
- Sold or leased (180 days)0
Market analysis — September 2026
The current inventory of commercial real estate in Fairfield, Ohio, as represented on Commrty, consists of 170 active listings. All of these active entries are focused on sale opportunities, with no active lease listings currently available. This inventory reflects a consistent set of available properties that have all been introduced to the platform within the last 90 days, with no new additions recorded in the most recent 30-day window. These figures provide a snapshot of the current supply available for acquisition within this specific local market. Pricing for the 13 listings that currently publish a sale price ranges from $99,000 to $4.9 million, resulting in a median asking price of $1.6 million. For investors evaluating these assets, the median advertised cap rate across the active listings is 6.30%. These financial metrics offer a baseline for potential buyers comparing investment opportunities within Fairfield. The composition of the 170 active listings is led by office properties, which account for 57 of the total. This is followed by 40 land parcels, 39 multifamily properties, 14 retail locations, and 10 each for industrial assets and businesses for sale. This diverse mix provides options for various professional requirements, from office-based operations to industrial or residential investment strategies. The absence of activity involving sales or leases in the last 180 days suggests that these current listings remain the primary pool for consideration for those actively searching for commercial assets in the region.
Figures are computed from active listings published on Commrty as of September 2026 and describe listed inventory, not the entire market. Analysis is generated from those figures and refreshed monthly.
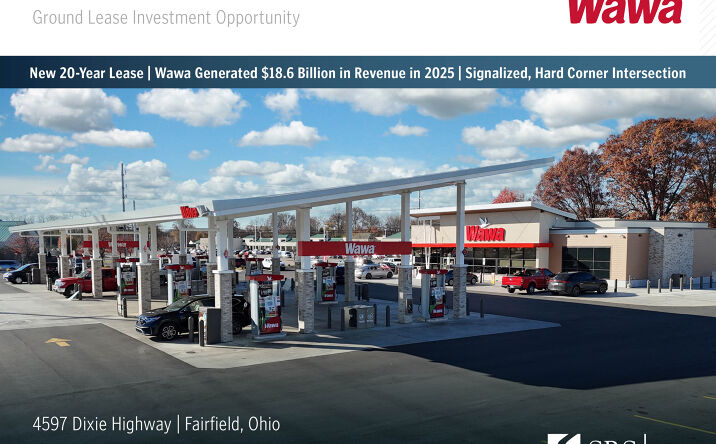
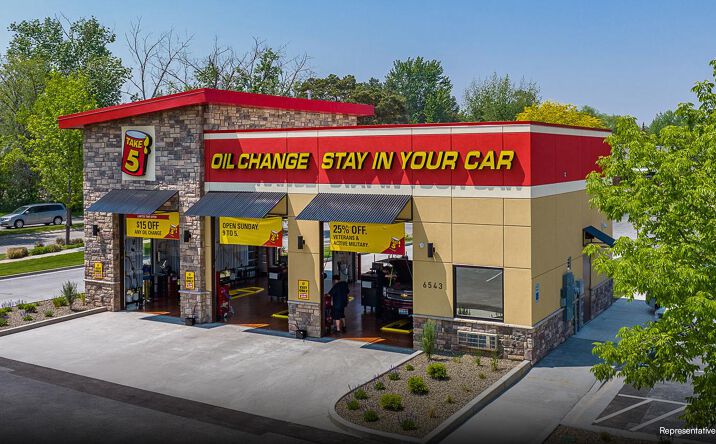
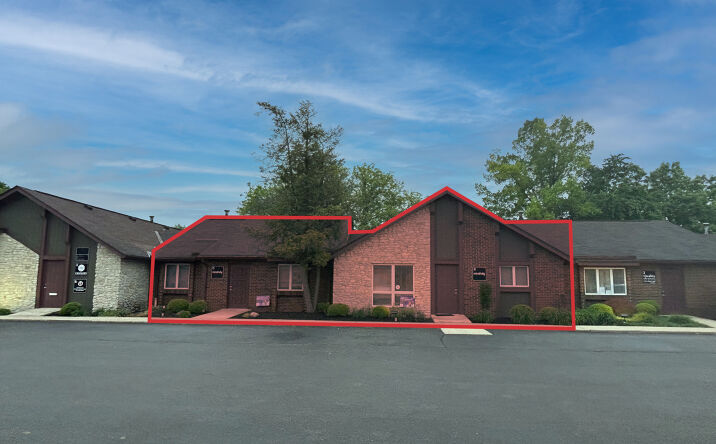
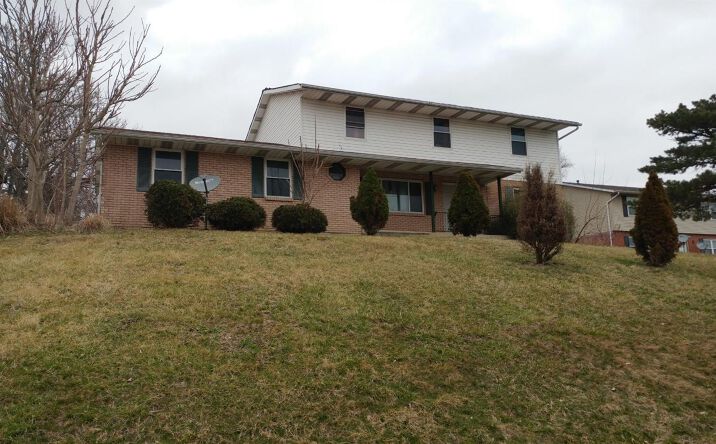
Featured Fairfield listings
 📍
📍 📍
📍 📍
📍