Columbus, Ohio Commercial Real Estate Market Report
As of September 2026 · 183 active listings tracked on Commrty
- Active listings
- 183
- For sale
- 183
- Median asking price
- $650K
- Avg. advertised cap rate
- 6.83%
- New in last 30 days
- 0
- Multifamily91 · 50%
- Retail43 · 23%
- Office13 · 7%
- Land11 · 6%
- Mixed Use10 · 5%
- Industrial8 · 4%
- Business for Sale3 · 2%
- Special Purpose3 · 2%
Based on 141 listings that publish an asking price.
- New in last 30 days0
- New in last 90 days183
- Sold or leased (180 days)0
Market analysis — September 2026
The Columbus commercial real estate market currently features 183 active listings on Commrty, all of which are offered for sale. This inventory represents a diverse spread of commercial assets available to regional investors. While the market has seen consistent activity regarding new listings over the past 90 days, there have been no listings added in the most recent 30-day period. This data reflects exclusively on properties currently being marketed through the Commrty platform rather than the entirety of the broader metropolitan inventory, offering a focused look at current supply levels for potential buyers operating within the region. Pricing for the 141 listings that publicly disclose an asking price ranges from $50,000 to $21,000,000, with a median price of $650,000. For investors evaluating these opportunities, the median advertised cap rate currently stands at 6.83%. These figures provide a baseline for understanding current valuation expectations among sellers in the area. Given the economic diversity of Columbus, ranging from government and education sectors to logistics and manufacturing hubs, these metrics allow investors to gauge the entry costs and yield expectations for various asset classes throughout the metropolitan area. The current inventory is heavily concentrated in multifamily assets, which account for 91 of the 183 listings. Retail properties follow with 43 listings, while office spaces account for 13 listings. Additional inventory includes 11 land parcels, 10 mixed-use developments, and 8 industrial sites, alongside smaller segments of business and special purpose opportunities. This distribution caters to a wide range of investment strategies, from those seeking residential income streams in the city's growing population centers to industrial operators capitalizing on the metro's central highway access and logistical connectivity to major Midwest markets.
Figures are computed from active listings published on Commrty as of September 2026 and describe listed inventory, not the entire market. Analysis is generated from those figures and refreshed monthly.
Featured Columbus listings
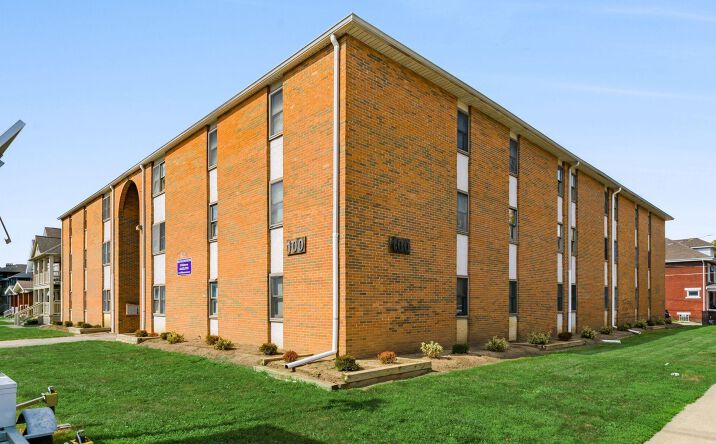 📍
📍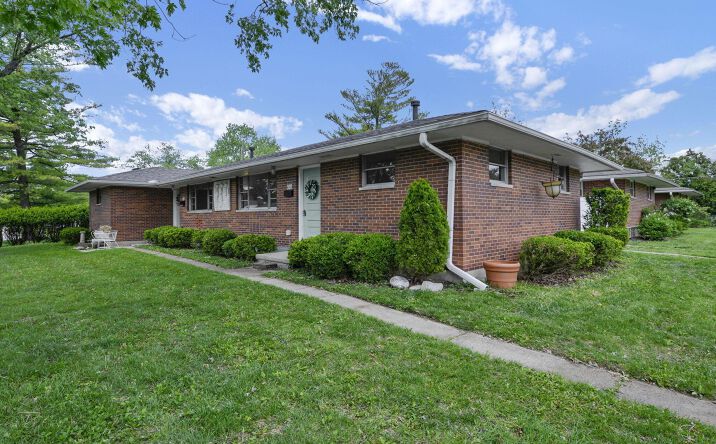 📍
📍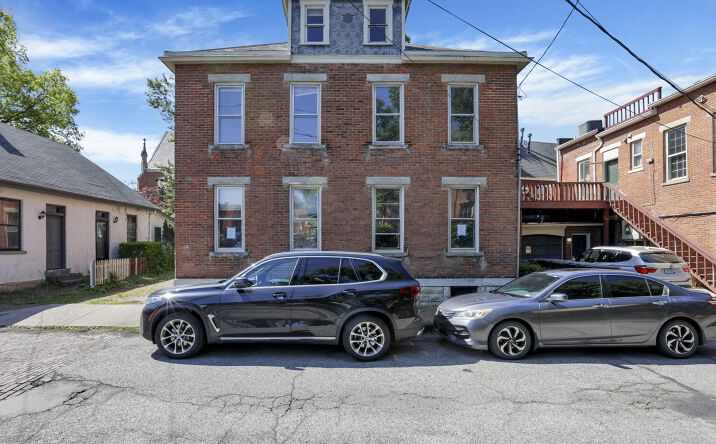 📍
📍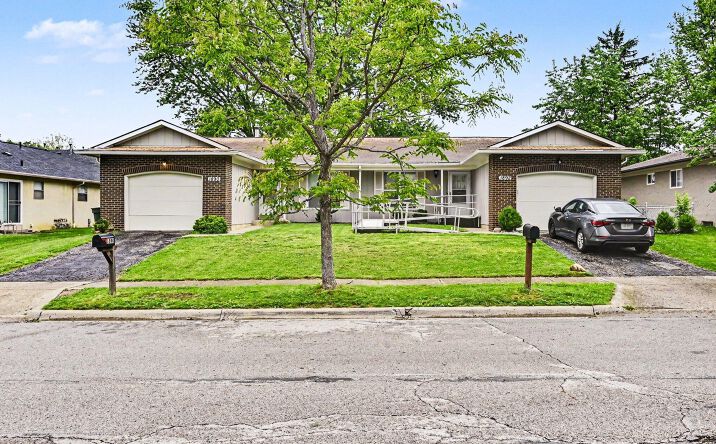 📍
📍 📍
📍 📍
📍