Cincinnati, Ohio Commercial Real Estate Market Report
As of September 2026 · 7,883 active listings tracked on Commrty
- Active listings
- 7,883
- For sale
- 7,883
- Median asking price
- $439K
- Avg. advertised cap rate
- 7.39%
- New in last 30 days
- 0
- Multifamily6,923 · 88%
- Land417 · 5%
- Retail181 · 2%
- Office173 · 2%
- Business for Sale85 · 1%
- Industrial85 · 1%
- Special Purpose17 · 0%
- Hospitality1 · 0%
Based on 306 listings that publish an asking price.
- New in last 30 days0
- New in last 90 days7,883
- Sold or leased (180 days)13
Market analysis — September 2026
The Cincinnati commercial real estate market presents a substantial volume of inventory for prospective buyers, with 7,883 active listings currently published on Commrty. All current active listings are structured for sale, with zero available for lease. The full volume of these 7,883 listings was added to the platform within the last 90 days, while 13 properties have been removed following a sale or lease transaction over the past 180 days. This inventory represents the total pool of accessible opportunities available to users navigating the regional marketplace at this time. Pricing for these Cincinnati assets shows significant variety across the board. Among the 306 listings that disclose specific financial terms, asking sale prices range from $60,000 to $27,000,000, with a median price point of $439,000. Investors looking for income-generating potential will find a median advertised cap rate of 7.39 percent. These figures serve as a baseline for understanding the current valuation environment for properties listed on the platform within this metropolitan area. The composition of the Cincinnati inventory is heavily weighted toward multifamily assets, which account for 6,923 of the listings. The remaining segment includes 417 land parcels, 181 retail properties, and 173 office buildings, alongside smaller portions of industrial, special purpose, and business-for-sale listings. This distribution suggests that the available supply is particularly suited for investors focused on residential acquisitions or residential development land. Those seeking specialized property types like industrial or hospitality will find significantly fewer options compared to the prevalent multifamily stock currently displayed on the platform.
Figures are computed from active listings published on Commrty as of September 2026 and describe listed inventory, not the entire market. Analysis is generated from those figures and refreshed monthly.
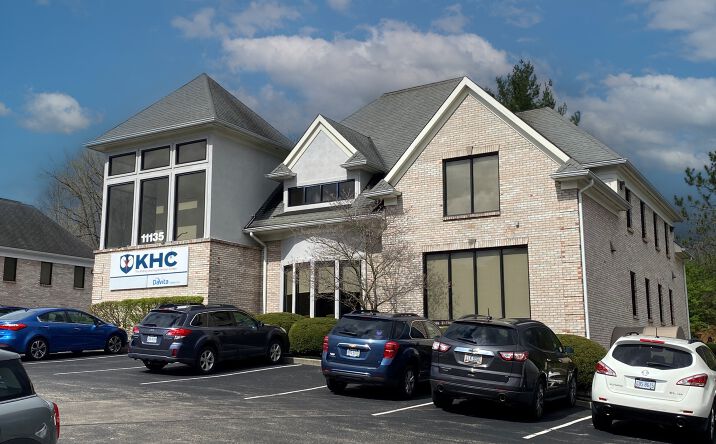
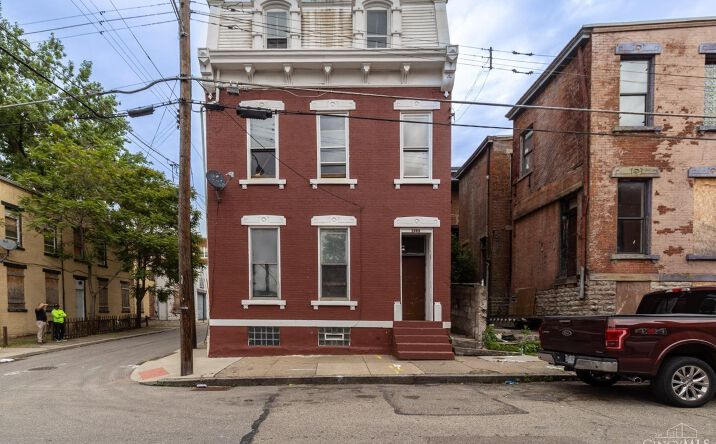
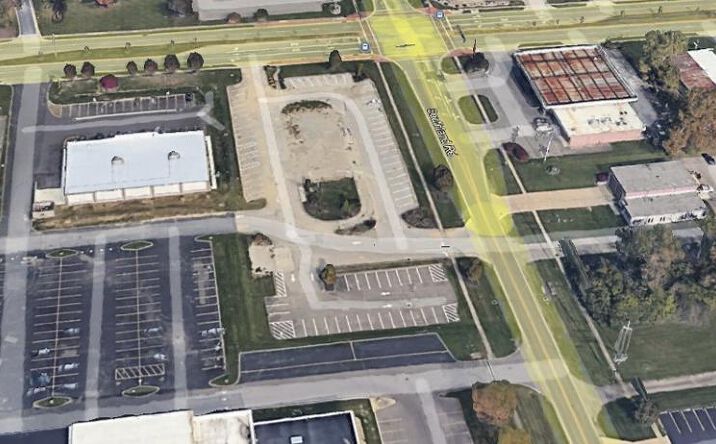
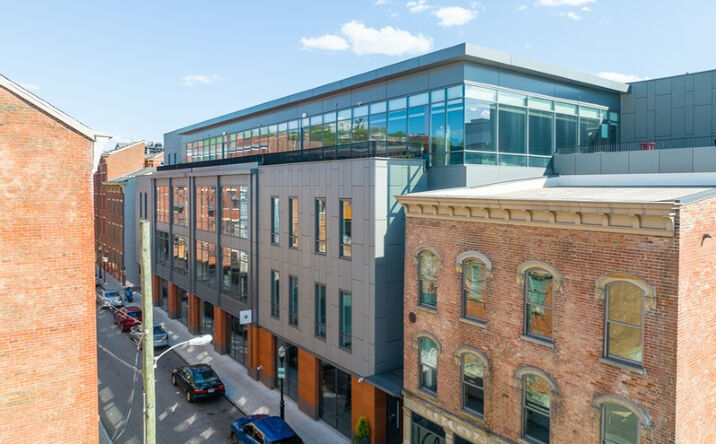
Featured Cincinnati listings
 📍
📍 📍
📍 📍
📍 📍
📍 📍
📍 📍
📍