Raleigh, North Carolina Commercial Real Estate Market Report
As of September 2026 · 89 active listings tracked on Commrty
- Active listings
- 89
- For sale
- 89
- Median asking price
- $2.1M
- Avg. advertised cap rate
- 6.76%
- New in last 30 days
- 0
- Office23 · 26%
- Retail23 · 26%
- Land19 · 21%
- Multifamily18 · 20%
- Industrial5 · 6%
- Mixed Use1 · 1%
Based on 61 listings that publish an asking price.
- New in last 30 days0
- New in last 90 days89
- Sold or leased (180 days)0
Market analysis — September 2026
The Raleigh commercial real estate market presents a diverse range of opportunities as reflected in the current inventory on Commrty. There are 89 active property listings, all of which are offered for sale. This pool of listings encompasses a broad spectrum of commercial needs within the region, which is historically supported by a stable economy linked to research, technology, and higher education. All 89 of these listings have been introduced to the platform within the last 90 days, providing a fresh snapshot of what is currently available for potential acquisition across this North Carolina capital city. Pricing for these active listings spans a wide range from $240,000 to $9.5 million. Among the 61 listings that have published a specific asking price, the median price stands at $2.1 million. For investors focused on return potential, the median advertised cap rate across these available properties is 6.76 percent. These metrics provide a baseline for evaluating capital deployment in a market characterized by a mix of established infrastructure and ongoing regional development near major transit corridors. The composition of the 89 listings is evenly distributed, with office spaces and retail properties each representing 23 listings. Land opportunities account for 19 listings, while multifamily assets contribute 18 options to the mix. The remaining inventory is comprised of five industrial properties and one mixed-use site. This balance suggests a market that accommodates varied investment strategies, from developers looking for raw land to those seeking operational commercial assets. Because there were no new listings added in the last 30 days, current participants should focus on the existing inventory to assess alignment with specific portfolio requirements.
Figures are computed from active listings published on Commrty as of September 2026 and describe listed inventory, not the entire market. Analysis is generated from those figures and refreshed monthly.
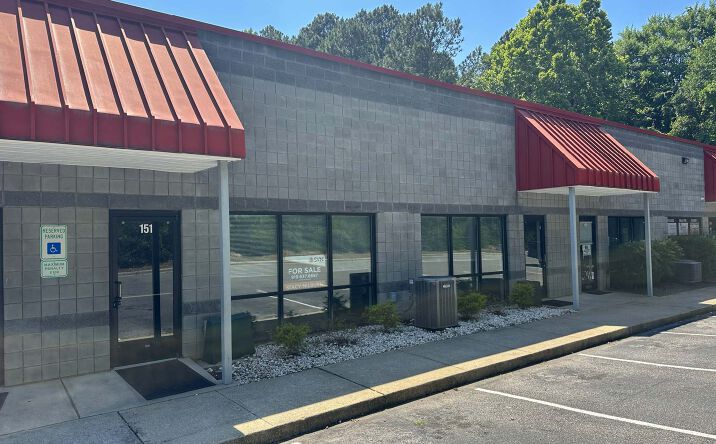
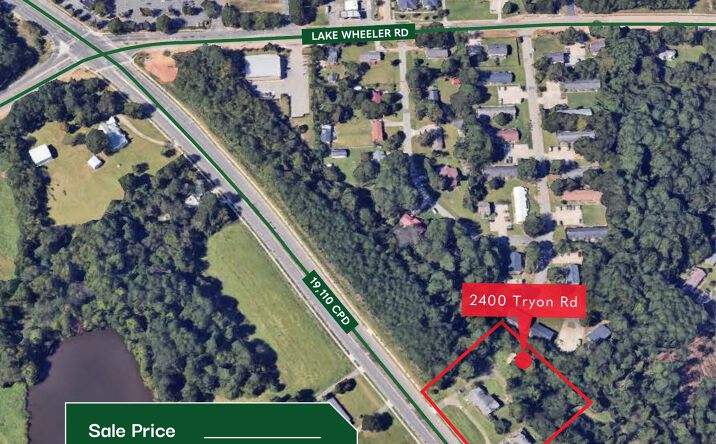
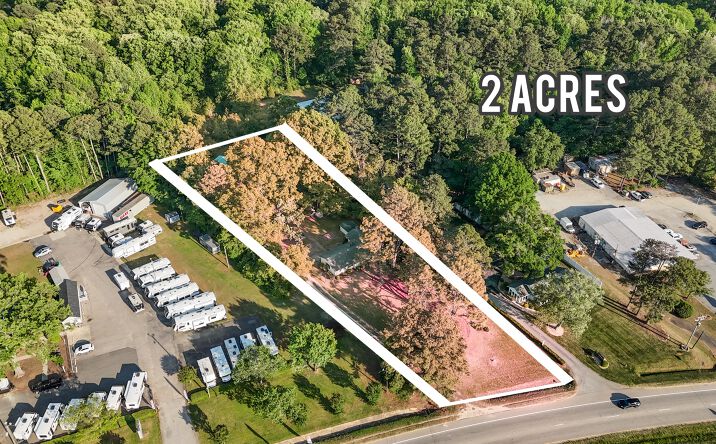
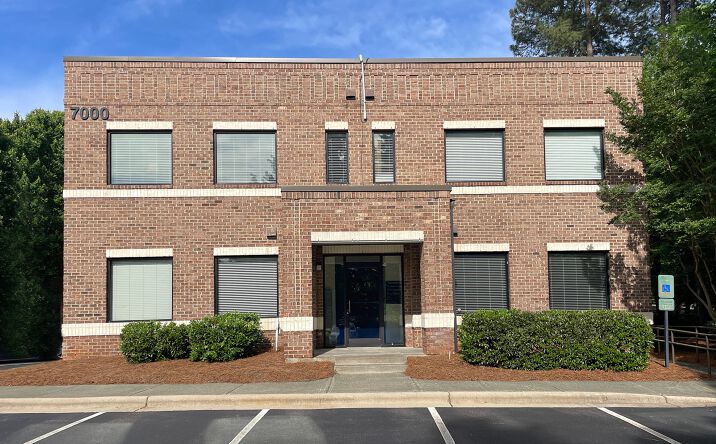
Featured Raleigh listings
 📍
📍 📍
📍 📍
📍 📍
📍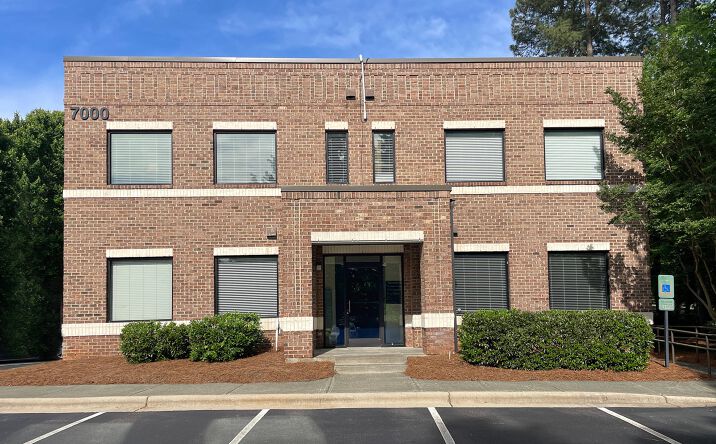 📍
📍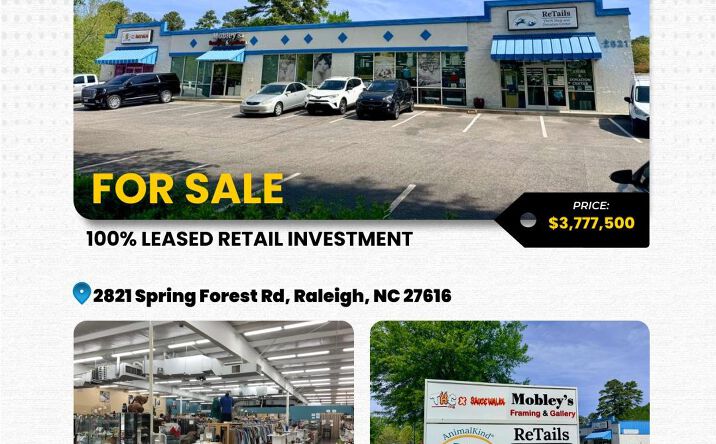 📍
📍