Las Vegas, Nevada Commercial Real Estate Market Report
As of September 2026 · 135 active listings tracked on Commrty
- Active listings
- 135
- For sale
- 135
- Median asking price
- $2M
- Avg. advertised cap rate
- 6.00%
- New in last 30 days
- 0
- Retail39 · 29%
- Office28 · 21%
- Land23 · 17%
- Industrial19 · 14%
- Multifamily16 · 12%
- Mixed Use6 · 4%
- Business for Sale3 · 2%
- Special Purpose1 · 1%
Based on 102 listings that publish an asking price.
- New in last 30 days0
- New in last 90 days135
- Sold or leased (180 days)0
Market analysis — September 2026
The current inventory of commercial real estate in Las Vegas on Commrty consists of 135 active listings, all of which are offered for sale. These properties were added to the platform within the last 90 days, with no new additions recorded in the previous month. The volume of listings currently reflects the total available supply on the marketplace, providing a snapshot of the market for investors focused on the region. This inventory serves as a primary reference for those tracking property availability in the Las Vegas metropolitan area as of September 2026. The listing activity remains focused entirely on acquisition opportunities rather than lease arrangements. Pricing for these active listings varies significantly, ranging from $599 to $112 million, with a median asking price of $2 million across the 102 properties that publish specific figures. Investors evaluating these opportunities can look to a median advertised cap rate of 6.00% as a baseline for current return expectations on Commrty. These figures are specific to the platform listings and do not represent the entire broader commercial market. Buyers should consider these valuations in the context of the region's existing economic foundation, which relies heavily on hospitality, gaming, and the growing logistics sector supported by key regional transportation networks. The property mix on Commrty includes 39 retail listings, 28 office assets, 23 land parcels, and 19 industrial facilities. Smaller segments consist of 16 multifamily properties, 6 mixed-use assets, 3 business sales, and 1 special purpose listing. This composition offers a variety of options for different investment strategies, ranging from land development to income-generating retail and industrial spaces. The diversity of the current inventory supports various user requirements, whether for owner-occupancy or long-term investment holding, as stakeholders assess the alignment of these specific assets with their individual operational needs.
Figures are computed from active listings published on Commrty as of September 2026 and describe listed inventory, not the entire market. Analysis is generated from those figures and refreshed monthly.
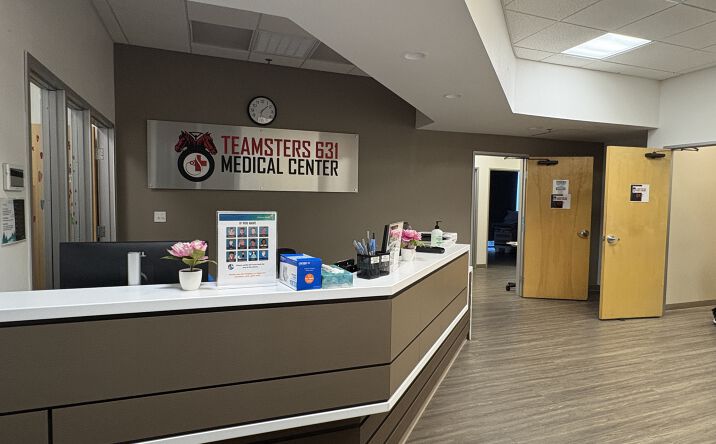
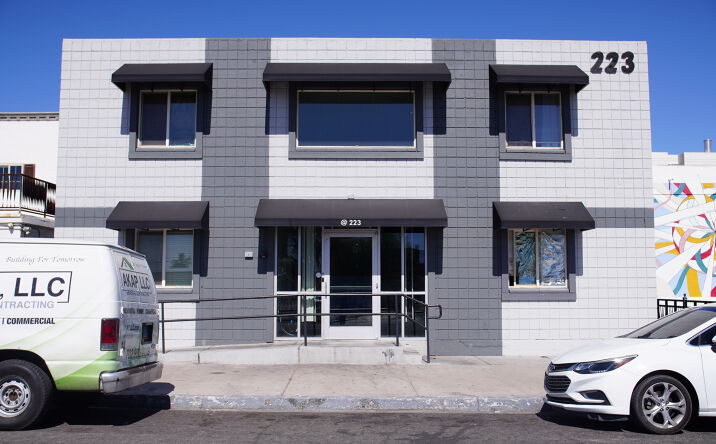
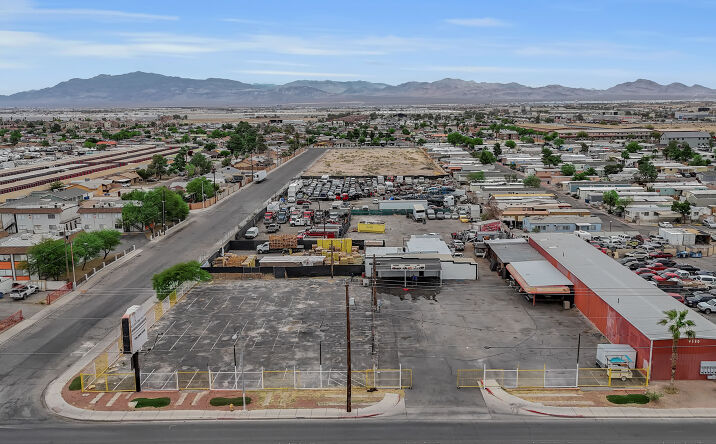
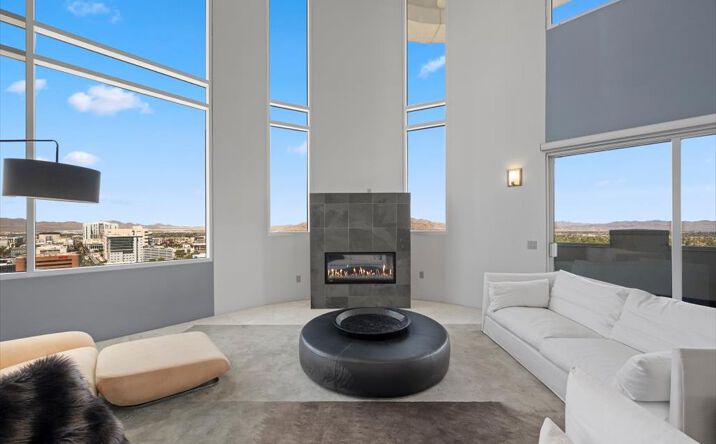
Featured Las Vegas listings
 📍
📍
 📍
📍 📍
📍 📍
📍