Kansas City, Missouri Commercial Real Estate Market Report
As of September 2026 · 214 active listings tracked on Commrty
- Active listings
- 214
- For sale
- 214
- Median asking price
- $145K
- Avg. advertised cap rate
- 6.61%
- New in last 30 days
- 0
- Land143 · 67%
- Retail34 · 16%
- Multifamily18 · 8%
- Office8 · 4%
- Industrial7 · 3%
- Hospitality2 · 1%
- Business for Sale1 · 0%
- Mixed Use1 · 0%
Based on 168 listings that publish an asking price.
- New in last 30 days0
- New in last 90 days214
- Sold or leased (180 days)0
Market analysis — September 2026
The active inventory in the Kansas City market on Commrty currently consists of 214 total listings, all of which are offered for sale. These properties represent the entirety of the platform's local availability as of September 2026. The inventory reflects a wide spectrum of entry points and investment sizes for participants in this region. Given Kansas City's central location and its role as a regional logistics and agricultural hub, these listings provide a snapshot of the available assets currently accessible through our platform, covering a range of scales from smaller parcels to larger commercial holdings. Pricing for the 168 assets that publish a price ranges from $5,000 to $21 million, with a median asking price of $145,000. The median advertised cap rate for these listings is 6.61%. This data serves as a point of reference for investors evaluating the current cost of acquisition relative to expected yields in the Kansas City metropolitan area. These figures provide a baseline for understanding the price expectations currently held by sellers across the platform's active inventory. The composition of the 214 listings is heavily weighted toward land, which accounts for 143 of the total assets. Retail follows with 34 listings, while multifamily properties represent 18 assets, office spaces account for 8, and industrial properties comprise 7. The remaining inventory is divided among hospitality, mixed-use, and business sale listings. This asset mix caters to a variety of stakeholders, ranging from developers focused on land acquisition to investors targeting specific income-producing property types like retail or industrial space that support the regional economy.
Figures are computed from active listings published on Commrty as of September 2026 and describe listed inventory, not the entire market. Analysis is generated from those figures and refreshed monthly.
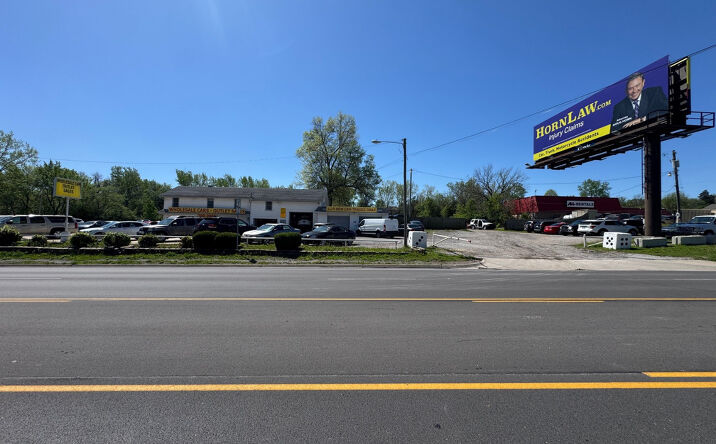
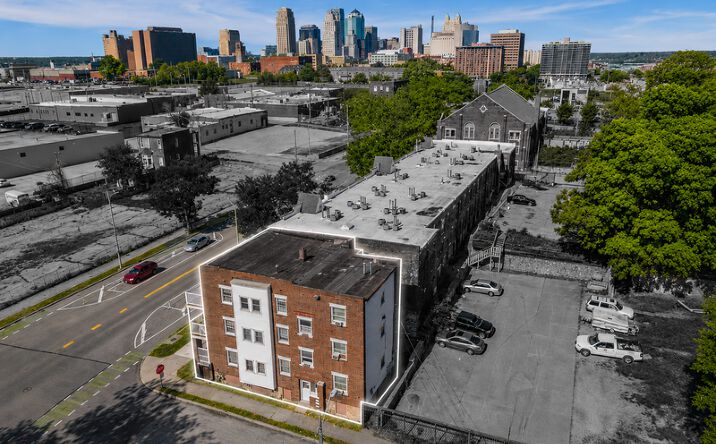
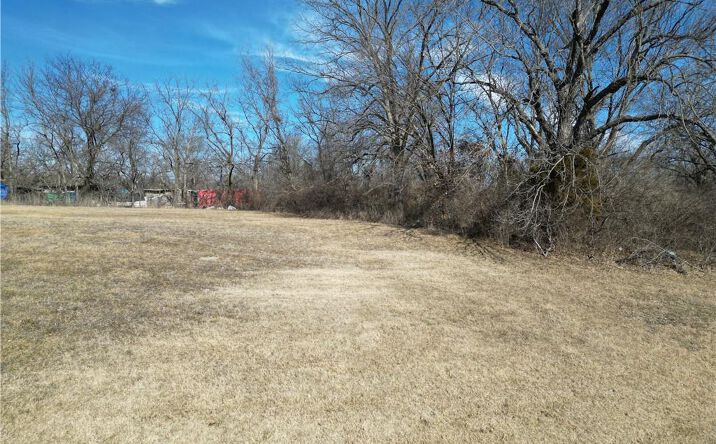
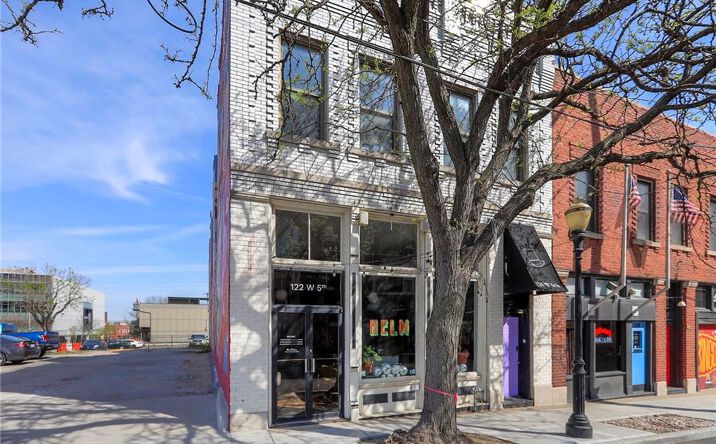
Featured Kansas City listings
 📍
📍
 📍
📍 📍
📍 📍
📍