Minneapolis, Minnesota Commercial Real Estate Market Report
As of September 2026 · 102 active listings tracked on Commrty
- Active listings
- 102
- For sale
- 102
- Median asking price
- $1.3M
- Avg. advertised cap rate
- 7.87%
- New in last 30 days
- 0
- Retail63 · 62%
- Multifamily26 · 25%
- Industrial5 · 5%
- Office3 · 3%
- Land2 · 2%
- Mixed Use2 · 2%
- Senior Living1 · 1%
Based on 40 listings that publish an asking price.
- New in last 30 days0
- New in last 90 days102
- Sold or leased (180 days)0
Market analysis — September 2026
The Minneapolis commercial real estate market currently shows 102 active listings on the Commrty platform, all of which are listed for sale. These listings reflect the diverse economic landscape of the Twin Cities, which serves as a major hub for retail, finance, and industrial sectors. All 102 listings on the platform have been added within the last 90 days, while no new listings were added in the most recent 30-day period. Currently, there is no activity on the platform regarding completed sales or leases within the previous 180 days, suggesting a focus on inventory exposure for current owners. Regarding pricing for the 40 listings that publish a specific figure, asking prices range from $125,000 to $16,000,000, with a median price of $1,300,000. Investors looking for entry points in the market can observe a median advertised cap rate of 7.87 percent. This data point offers a baseline for evaluating potential cash flow across the available asset classes in the region. The inventory is heavily weighted toward retail properties, which account for 63 of the 102 active listings. Multifamily assets follow with 26 listings, while industrial, office, land, mixed-use, and senior living properties make up the remainder. This concentration suggests that current opportunities are primarily structured for retail investors and residential real estate operators. These listings provide a snapshot of the current market availability for those analyzing commercial opportunities across the Minneapolis area.
Figures are computed from active listings published on Commrty as of September 2026 and describe listed inventory, not the entire market. Analysis is generated from those figures and refreshed monthly.
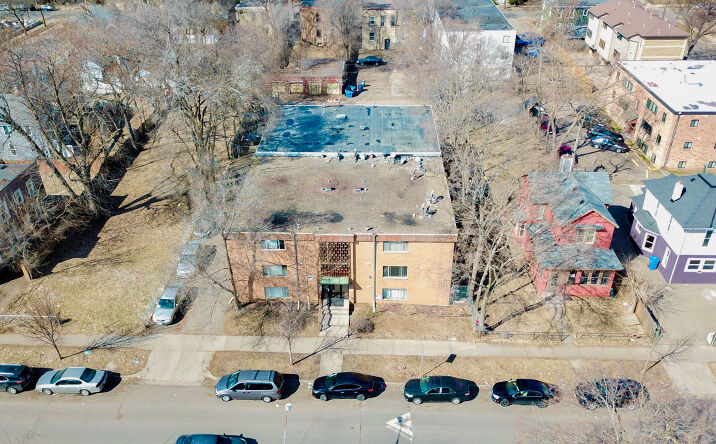
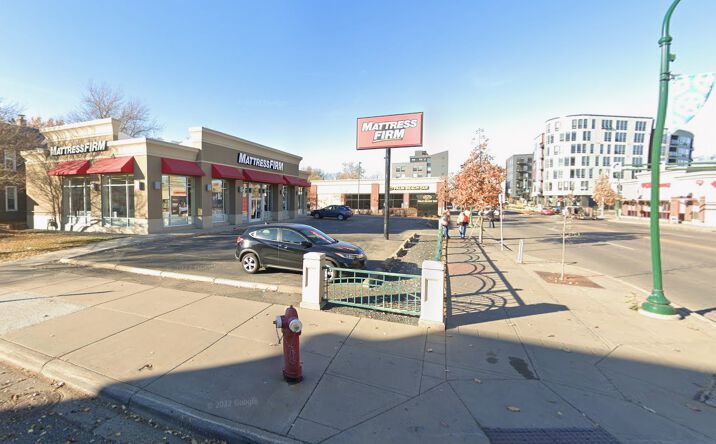
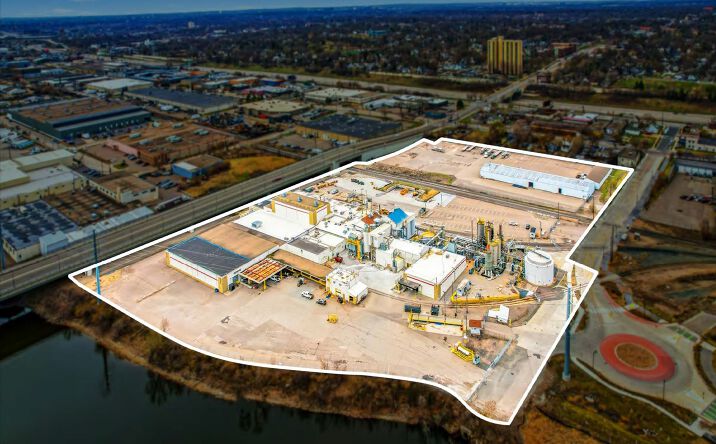
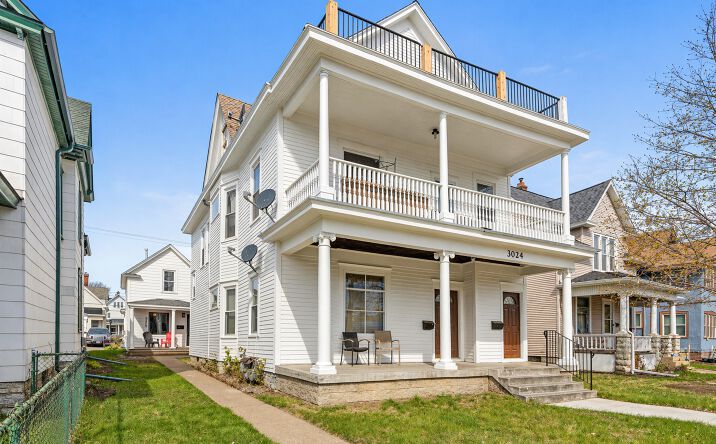
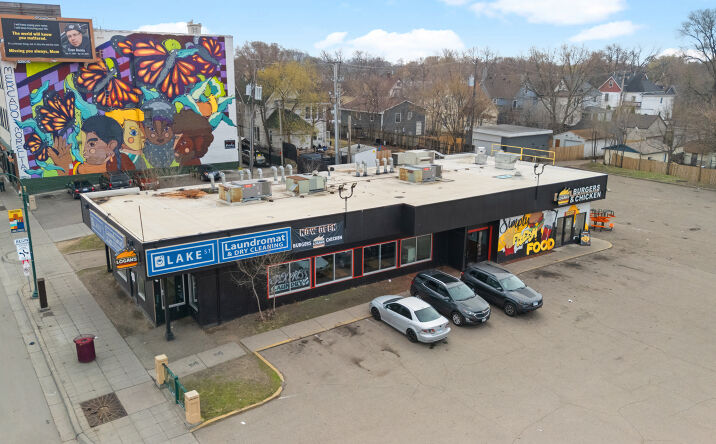
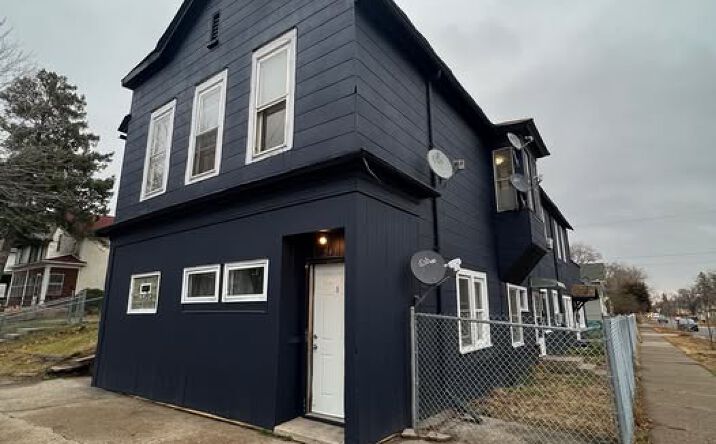
Featured Minneapolis listings
 📍
📍 📍
📍
 📍
📍 📍
📍