New Orleans, Louisiana Commercial Real Estate Market Report
As of September 2026 · 93 active listings tracked on Commrty
- Active listings
- 93
- For sale
- 93
- Median asking price
- $1.4M
- Avg. advertised cap rate
- 7.89%
- New in last 30 days
- 0
- Retail28 · 30%
- Multifamily21 · 23%
- Land16 · 17%
- Office14 · 15%
- Mixed Use5 · 5%
- Hospitality3 · 3%
- Industrial3 · 3%
- Special Purpose2 · 2%
Based on 78 listings that publish an asking price.
- New in last 30 days0
- New in last 90 days93
- Sold or leased (180 days)0
Market analysis — September 2026
The New Orleans commercial real estate market currently features 93 active listings on Commrty, all of which are available for sale. These properties entered the marketplace within the last 90 days, reflecting the current scope of available inventory. New Orleans remains a distinct market defined by its unique historic architecture and importance as a hub for tourism, shipping, and energy sectors. Because no new listings have been added in the past 30 days and no transactions were finalized in the last 180 days, these 93 active listings provide a static snapshot of current regional availability. Property pricing across these active Commrty listings spans a broad range, starting at $50,000 and extending up to $7.5 million. Among the 78 listings that disclose an asking price, the median price sits at $1.4 million. Investors evaluating these opportunities will find a median advertised cap rate of 7.89%. This pricing reflects the risk and return profile of the diverse properties currently circulating in the local landscape, offering various entry points for those seeking exposure to the regional economy. The asset composition is led by 28 retail properties and 21 multifamily listings, which together represent the majority of available inventory. Other segments include 16 parcels of land, 14 office buildings, and 5 mixed-use properties, with a smaller selection of hospitality, industrial, and special purpose assets rounding out the total. This mix provides options for buyers targeting both small-scale commercial operations and larger multi-tenant investments. Prospective purchasers can utilize this Commrty data to conduct comparative analysis on these asset classes as they navigate the current market conditions in New Orleans.
Figures are computed from active listings published on Commrty as of September 2026 and describe listed inventory, not the entire market. Analysis is generated from those figures and refreshed monthly.
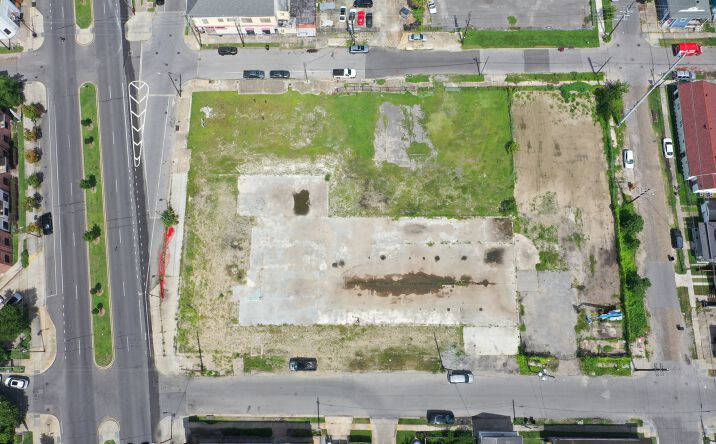
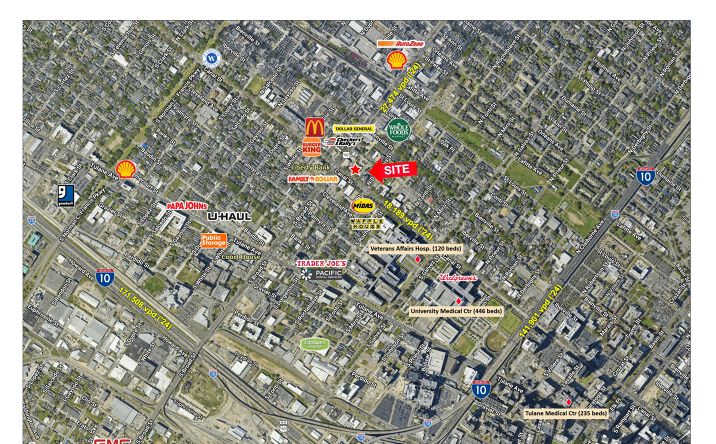
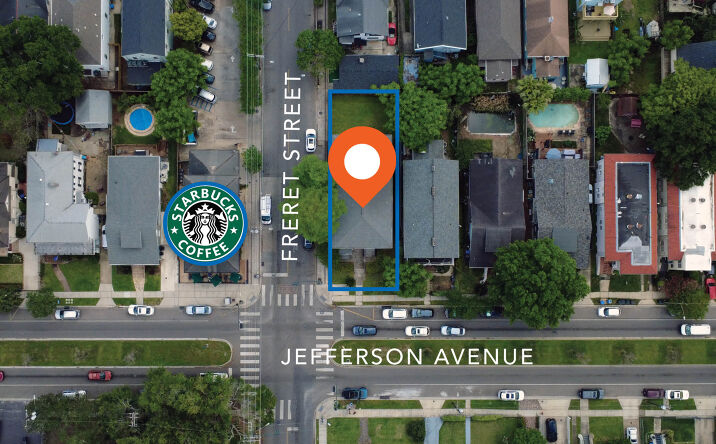
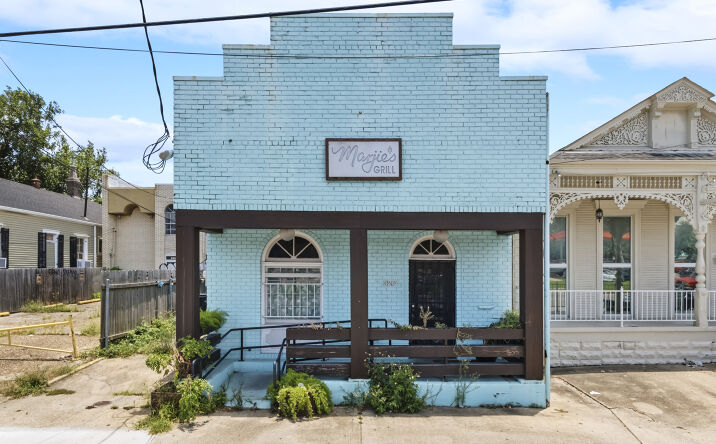
Featured New Orleans listings
 📍
📍 📍
📍 📍
📍 📍
📍 📍
📍