Indianapolis, Indiana Commercial Real Estate Market Report
As of September 2026 · 141 active listings tracked on Commrty
- Active listings
- 141
- For sale
- 141
- Median asking price
- $1.2M
- Avg. advertised cap rate
- 7.65%
- New in last 30 days
- 0
- Retail65 · 46%
- Land22 · 16%
- Multifamily16 · 11%
- Office15 · 11%
- Industrial13 · 9%
- Mixed Use4 · 3%
- Business for Sale3 · 2%
- Special Purpose3 · 2%
Based on 90 listings that publish an asking price.
- New in last 30 days0
- New in last 90 days141
- Sold or leased (180 days)0
Market analysis — September 2026
The Indianapolis commercial real estate market currently shows 141 active listings available for sale on Commrty. These listings represent the total available inventory within the platform, with no new entries recorded during the previous 30-day period. All 141 listings represent properties for sale, reflecting the current state of assets listed specifically through this marketplace. As a central logistics and distribution hub for the Midwest, Indianapolis maintains a diverse economic base that supports a steady supply of commercial assets across various categories. These listings provide a snapshot of current options for investors and businesses evaluating regional real estate opportunities. Pricing for the 90 assets that publish an asking price ranges from $55,000 to $29,000,000, with a median price of $1,200,000. For these listings, the median advertised cap rate stands at 7.65 percent. These metrics offer a baseline for investors assessing current value expectations in the local market. Prospective buyers should consider these figures as representations of the active inventory currently published on Commrty, as they provide a clear range of the financial scale involved in the available commercial real estate options throughout the Indianapolis metropolitan area. The inventory composition on Commrty is led by 65 retail properties and 22 parcels of land. The remainder of the listings include 16 multifamily assets, 15 office properties, 13 industrial facilities, and smaller segments of mixed-use, business for sale, and special purpose properties. This distribution serves a broad spectrum of market participants, from retail operators and developers to industrial users seeking space in this major transportation corridor. The variety of asset types highlights the diverse utility of the local inventory, catering to different business needs and investment strategies currently present within the Indianapolis region.
Figures are computed from active listings published on Commrty as of September 2026 and describe listed inventory, not the entire market. Analysis is generated from those figures and refreshed monthly.
Featured Indianapolis listings
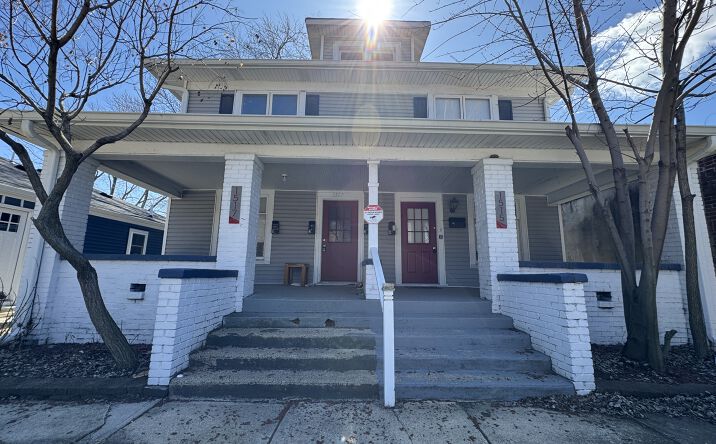 📍
📍 📍
📍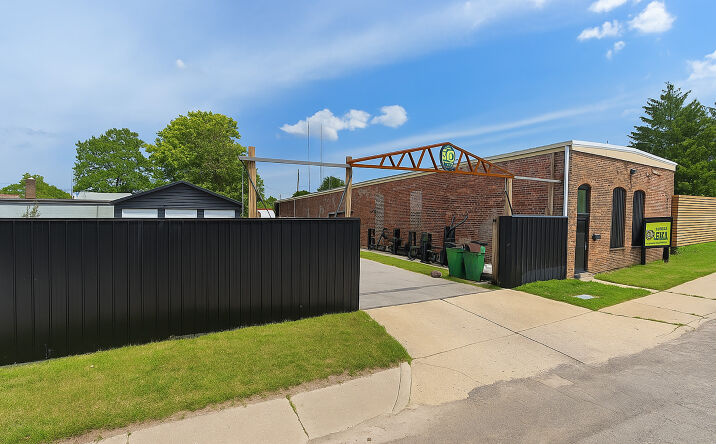 📍
📍 📍
📍 📍
📍 📍
📍