Blue Ridge, Georgia Commercial Real Estate Market Report
As of September 2026 · 447 active listings tracked on Commrty
- Active listings
- 447
- For sale
- 447
- Median asking price
- $272K
- Avg. advertised cap rate
- 9.00%
- New in last 30 days
- 0
- Land386 · 86%
- Retail35 · 8%
- Business for Sale12 · 3%
- Office9 · 2%
- Industrial5 · 1%
Based on 42 listings that publish an asking price.
- New in last 30 days0
- New in last 90 days447
- Sold or leased (180 days)0
Market analysis — September 2026
The commercial real estate landscape in Blue Ridge, Georgia currently features 447 active listings exclusively for sale on the Commrty marketplace. This entire inventory of 447 properties has been introduced to the platform within the last 90 days, while no new listings have been added in the most recent 30-day period. Currently, there is no transactional activity to report, as zero properties have been sold or leased on the platform in the last 180 days. This baseline of active listings provides a snapshot of the current inventory available for investors evaluating the area. Pricing for these active listings spans a wide range from $59,000 to $3.5 million, with a median asking price of $272,000 among the 42 listings that disclose a price. Investors targeting this region can expect a median advertised cap rate of 9.00%. These metrics offer a preliminary look at the current valuation expectations for properties listed on the platform within the Blue Ridge market. The composition of the inventory is heavily weighted toward land, which accounts for 386 of the active sale listings. The remaining active listings consist of 35 retail properties, 12 businesses for sale, 9 office spaces, and 5 industrial properties. This asset mix is particularly relevant for buyers interested in land development or smaller-scale retail and commercial operations. These property types cater to a specific segment of the local market, allowing potential investors to align their search with the specific asset classes currently represented on Commrty.
Figures are computed from active listings published on Commrty as of September 2026 and describe listed inventory, not the entire market. Analysis is generated from those figures and refreshed monthly.
Featured Blue Ridge listings
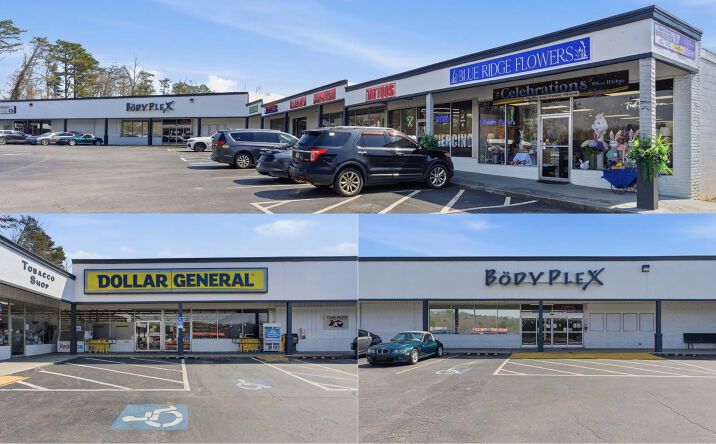
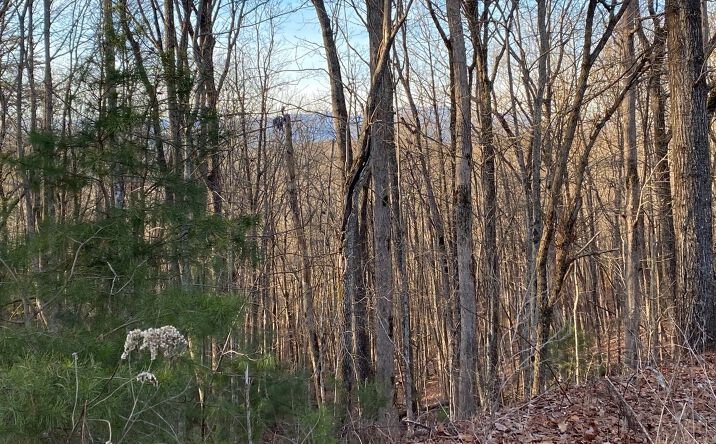 📍
📍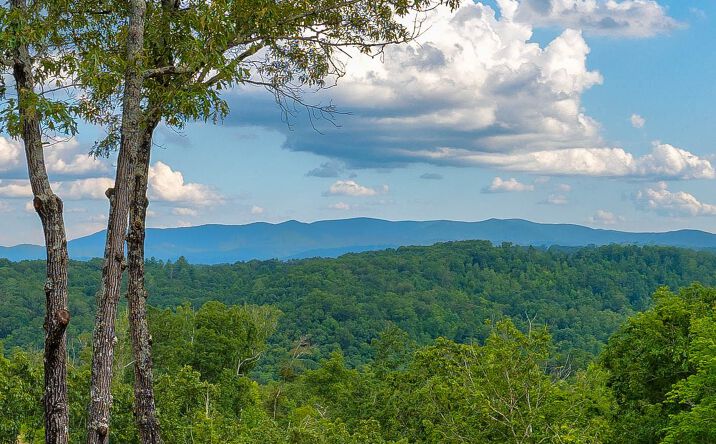 📍
📍 📍
📍 📍
📍 📍
📍