Atlanta, Georgia Commercial Real Estate Market Report
As of September 2026 · 133 active listings tracked on Commrty
- Active listings
- 133
- For sale
- 133
- Median asking price
- $1.2M
- Avg. advertised cap rate
- 6.50%
- New in last 30 days
- 0
- Retail34 · 26%
- Land23 · 17%
- Multifamily20 · 15%
- Office19 · 14%
- Industrial14 · 11%
- Mixed Use12 · 9%
- Business for Sale5 · 4%
- Special Purpose4 · 3%
Based on 93 listings that publish an asking price.
- New in last 30 days0
- New in last 90 days133
- Sold or leased (180 days)0
Market analysis — September 2026
The Atlanta commercial real estate market currently features 133 active sale listings on Commrty. As a major logistics and economic hub for the Southeast, the city remains a significant focal point for diverse investment strategies. The inventory composition is broad, reflecting the city’s role as a population center with extensive interstate infrastructure. All 133 listings currently available were added to the platform within the last 90 days, with no new additions recorded in the most recent 30-day period. This reflects a concentrated window of supply currently accessible to users browsing the marketplace for regional acquisition opportunities. Pricing for properties on the platform shows a wide range, spanning from $59,000 to $41,000,000. Among the 93 listings that publish a specific price, the median asking price sits at $1,200,000. Investors evaluating these opportunities will find a median advertised cap rate of 6.50% across the active listings. These figures provide a baseline for understanding the current valuation environment for assets listed on Commrty in the Atlanta metro area. The asset mix is dominated by 34 retail properties and 23 land parcels, followed by 20 multifamily units and 19 office buildings. Smaller segments include industrial, mixed-use, business for sale, and special purpose listings. This composition serves a variety of market participants, from developers focused on land and retail to investors targeting residential or office income streams. Because all 133 listings are exclusively for sale, the data is best utilized by buyers to benchmark current asking prices and evaluate the variety of property types available within the Atlanta regional market.
Figures are computed from active listings published on Commrty as of September 2026 and describe listed inventory, not the entire market. Analysis is generated from those figures and refreshed monthly.
Featured Atlanta listings
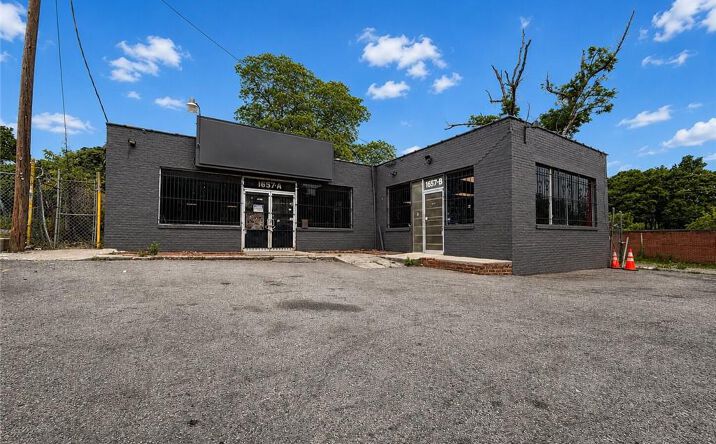 📍
📍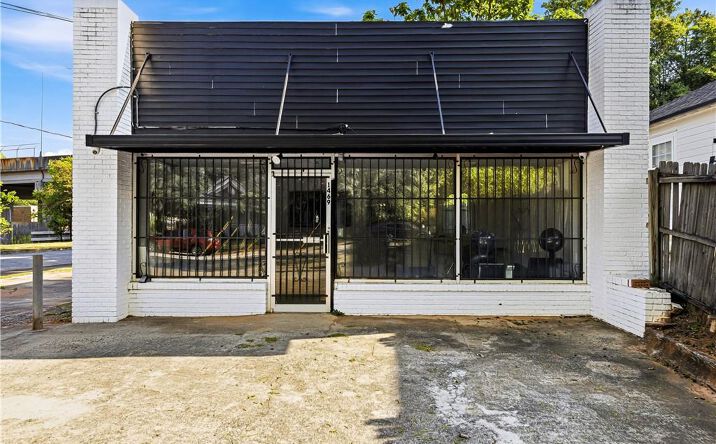 📍
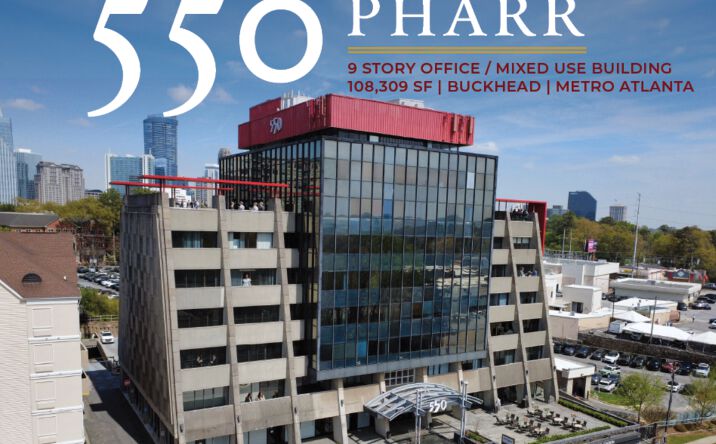
📍
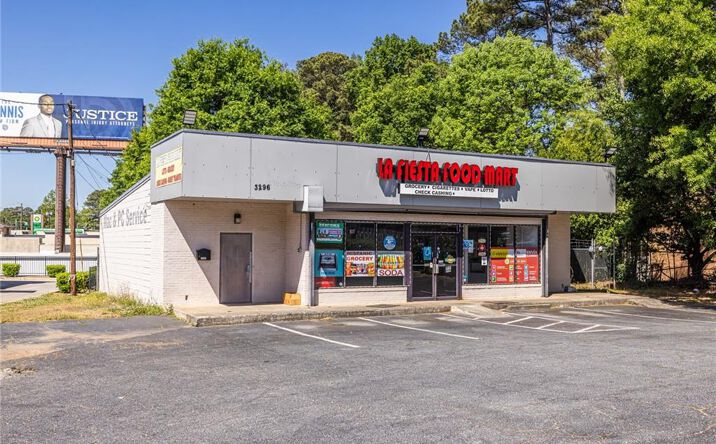 📍
📍 📍
📍 📍
📍