Oakland Park, Florida Commercial Real Estate Market Report
As of September 2026 · 471 active listings tracked on Commrty
- Active listings
- 471
- For sale
- 464
- For lease
- 7
- Median asking price
- $1M
- Avg. advertised cap rate
- 6.22%
- New in last 30 days
- 0
- Multifamily327 · 69%
- Business for Sale60 · 13%
- Industrial37 · 8%
- Land14 · 3%
- Retail12 · 3%
- Office11 · 2%
- Mixed Use7 · 1%
- Special Purpose3 · 1%
Based on 42 listings that publish an asking price.
- New in last 30 days0
- New in last 90 days471
- Sold or leased (180 days)1
Market analysis — September 2026
The current inventory of Oakland Park, Florida, listings on Commrty consists of 471 total active entries. The vast majority of these listings are positioned for sale, totaling 464 properties, while only 7 listings are currently available for lease. All 471 of these properties entered the market within the last 90 days, with no new additions recorded in the most recent 30-day period. These figures reflect the current active volume of real estate opportunities available to users browsing the platform in this specific region of Florida, characterized by its accessibility to major coastal infrastructure and transit corridors. Pricing for these active listings is varied, with 42 properties publishing a specific asking price ranging from $2 million to $11 million, while the median advertised price stands at $1 million. For investors assessing potential income-generating assets, the median advertised cap rate currently sits at 6.22 percent. These pricing metrics provide a baseline for market participants evaluating entry points across different asset classes within this segment of the local economy. The composition of available listings is dominated by 327 multifamily properties, indicating a strong focus on residential investment opportunities. Additionally, there are 60 businesses for sale, 37 industrial assets, 14 land parcels, 12 retail sites, 11 office spaces, 7 mixed-use properties, and 3 special purpose buildings. This diverse mix offers options for various buyer profiles, ranging from residential investors and business operators to industrial and commercial developers seeking to capitalize on the region's diverse economic base. The limited turnover, with only one asset sold or leased in the last 180 days, underscores the current holding patterns.
Figures are computed from active listings published on Commrty as of September 2026 and describe listed inventory, not the entire market. Analysis is generated from those figures and refreshed monthly.
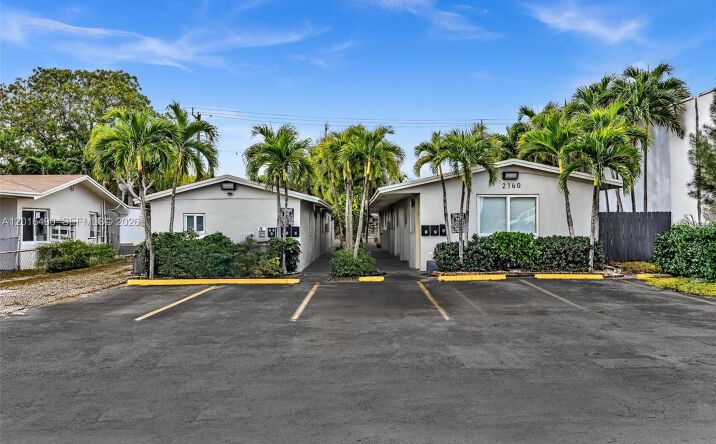
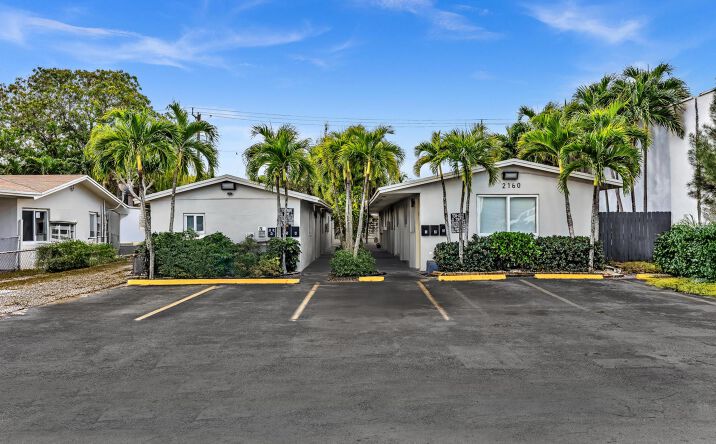
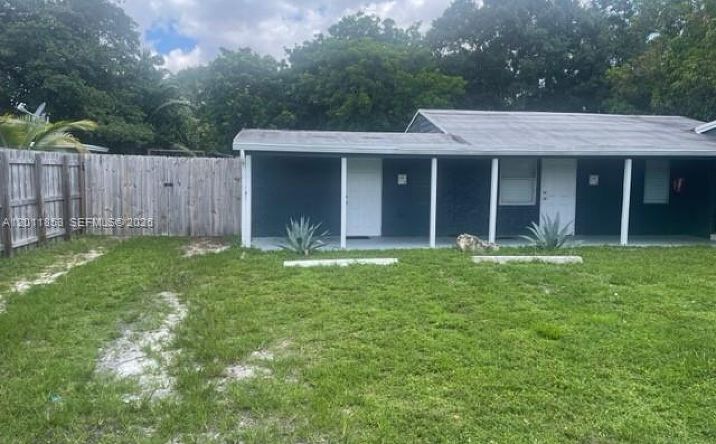
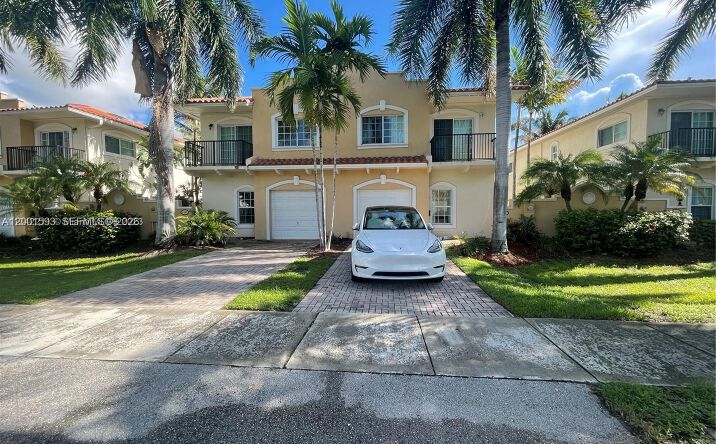
Featured Oakland Park listings
 📍
📍
 📍
📍 📍
📍 📍
📍 📍
📍