Miami, Florida Commercial Real Estate Market Report
As of September 2026 · 1,235 active listings tracked on Commrty
- Active listings
- 1,235
- For sale
- 1,159
- For lease
- 76
- Median asking price
- $1M
- Avg. advertised cap rate
- 5.27%
- New in last 30 days
- 0
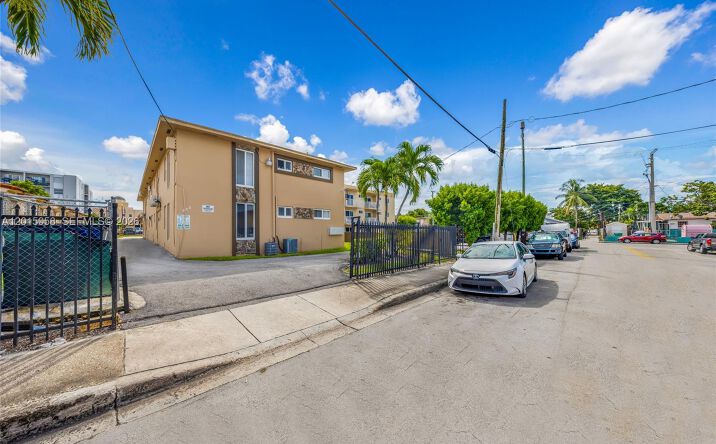
- Multifamily556 · 45%
- Retail254 · 21%
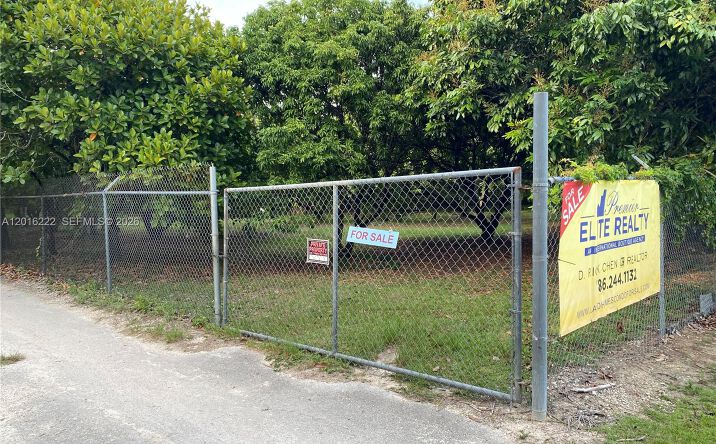
- Land116 · 9%
- Business for Sale99 · 8%
- Office92 · 7%
- Industrial78 · 6%
- Mixed Use24 · 2%
- Special Purpose11 · 1%
Based on 604 listings that publish an asking price.
- New in last 30 days0
- New in last 90 days1,235
- Sold or leased (180 days)4
Market analysis — September 2026
The Miami commercial real estate market currently presents 1,235 active listings on the Commrty platform. This inventory consists primarily of 1,159 properties available for sale, while 76 listings are currently offered for lease. All 1,235 of these listings were added to the marketplace over the past 90 days, reflecting the current scope of searchable opportunities. With a total of four properties successfully moved through the platform over the last 180 days, the available inventory provides a snapshot of the current distribution of assets across the region's diverse economic landscape. Pricing for these active listings shows a median sale price of $1 million, with 604 listings currently publishing an asking price. The range of asking prices extends from zero up to $8 billion across the available inventory. Investors currently evaluating these assets will find a median advertised cap rate of 5.27 percent, which serves as a baseline for assessing potential returns within the metro area. The market composition is led by 556 multifamily listings, followed by 254 retail and 116 land listings. Other available segments include 99 business opportunities, 92 office properties, 78 industrial sites, 24 mixed-use assets, and 11 special purpose facilities. This variety caters to different buyer and tenant profiles ranging from institutional groups seeking large-scale residential plays to local businesses looking for specific retail or office footprints. Commrty users can utilize these figures to compare asset types and pricing structures across the broader Miami landscape to inform their investment decisions.
Figures are computed from active listings published on Commrty as of September 2026 and describe listed inventory, not the entire market. Analysis is generated from those figures and refreshed monthly.
Featured Miami listings
 📍
📍 📍
📍 📍
📍
 📍
📍 📍
📍