Dania Beach, Florida Commercial Real Estate Market Report
As of September 2026 · 322 active listings tracked on Commrty
- Active listings
- 322
- For sale
- 319
- For lease
- 3
- Median asking price
- $900K
- Avg. advertised cap rate
- 5.13%
- New in last 30 days
- 0
- Multifamily244 · 76%
- Land21 · 7%
- Business for Sale15 · 5%
- Retail15 · 5%
- Industrial13 · 4%
- Office7 · 2%
- Special Purpose4 · 1%
- Mixed Use3 · 1%
Based on 37 listings that publish an asking price.
- New in last 30 days0
- New in last 90 days322
- Sold or leased (180 days)0
Market analysis — September 2026
The commercial real estate market in Dania Beach, Florida currently shows 322 active listings on Commrty. The vast majority of these opportunities are structured for sale, with 319 properties listed for purchase and only three currently available for lease. All 322 of these listings entered the platform within the last 90 days, while no new listings were added in the most recent 30-day period. Current data indicates that there have been no sales or leasing completions recorded on the platform within the last 180 days, representing a stagnant inventory environment for active participants. Pricing for the 37 assets that have published asking prices ranges from $3 million to $17 million, with a median price point of $900,000 across the subset. The median advertised cap rate for these listings is 5.13%. These figures provide a baseline for investors assessing the current cost of entry and yield potential in the local market. Multifamily assets dominate the landscape with 244 listings, followed by smaller segments of land, business sales, retail, and industrial properties. Smaller quantities of office, special purpose, and mixed-use listings round out the platform's current inventory. This composition is well-suited for investors focused on residential growth or industrial and retail service providers looking for footprint in the area. Participants should use these metrics as a snapshot of available inventory to identify asset classes that align with their specific capital allocation strategies.
Figures are computed from active listings published on Commrty as of September 2026 and describe listed inventory, not the entire market. Analysis is generated from those figures and refreshed monthly.
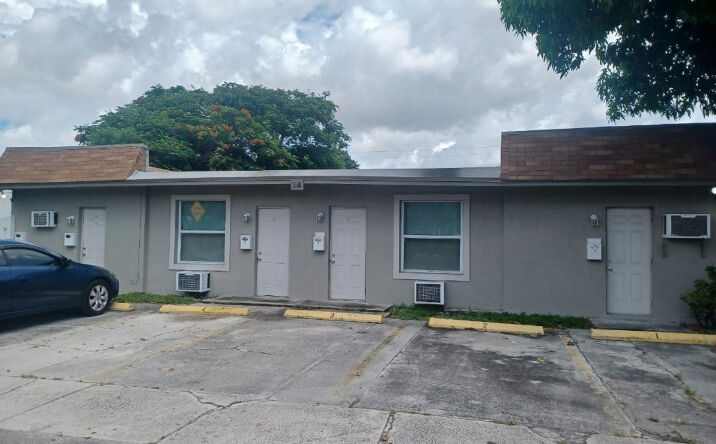
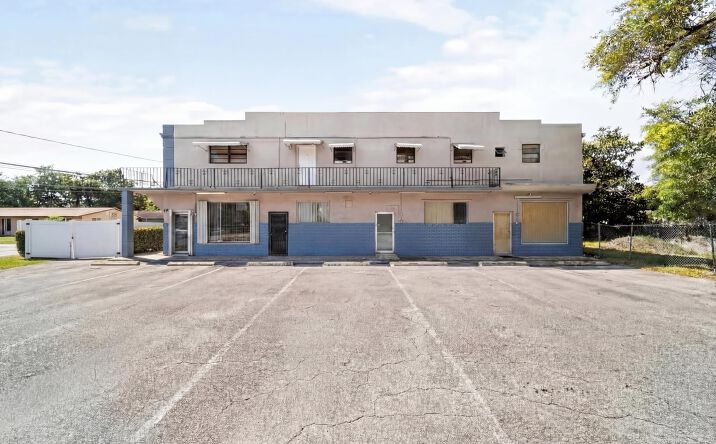
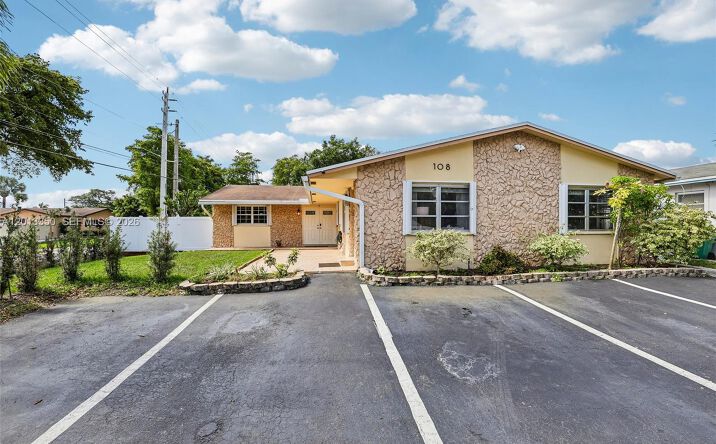
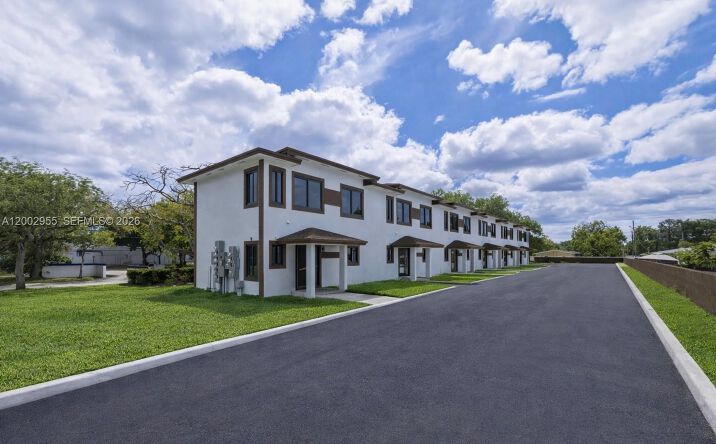
Featured Dania Beach listings
 📍
📍 📍
📍