Colorado Springs, Colorado Commercial Real Estate Market Report
As of September 2026 · 107 active listings tracked on Commrty
- Active listings
- 107
- For sale
- 107
- Median asking price
- $1.5M
- Avg. advertised cap rate
- 6.36%
- New in last 30 days
- 0
- Retail29 · 27%
- Land20 · 19%
- Industrial18 · 17%
- Office17 · 16%
- Multifamily16 · 15%
- Hospitality3 · 3%
- Special Purpose2 · 2%
- Business for Sale1 · 1%
Based on 84 listings that publish an asking price.
- New in last 30 days0
- New in last 90 days107
- Sold or leased (180 days)0
Market analysis — September 2026
The Colorado Springs commercial real estate market currently shows 107 active listings on the Commrty platform, all of which are offered for sale. These listings reflect the breadth of the local economy, which remains anchored by military installations, aerospace industries, and a steady influx of residents. All 107 listings identified in the current data set were added within the last 90 days, with no new entries recorded in the most recent 30-day period. This indicates a concentrated influx of properties entering the marketplace during the broader summer window as participants evaluated their portfolios across this front range hub. Across the 84 listings that publish an asking price, figures range from $21,000 to $17,000,000, with a median price point of $1,500,000. Investors looking at these active listings will find a median advertised cap rate of 6.36%. These financial metrics provide a baseline for assessing the current pricing expectations held by property owners within the platform. Given the diverse range of price points, the market supports a variety of capital deployment strategies, from smaller speculative land holds to larger, stabilized commercial assets located near major corridors like Interstate 25. The composition of active listings on Commrty is led by 29 retail properties and 20 parcels of land. The inventory also includes 18 industrial assets, 17 office properties, and 16 multifamily buildings, alongside smaller numbers of hospitality and special purpose facilities. This distribution is well-suited for buyers ranging from local business owners seeking retail or industrial footprints to regional investors targeting multifamily or office investments. Because these figures represent specific platform data rather than the entire metropolitan area, this inventory serves as a targeted sample of the current active supply available for acquisition.
Figures are computed from active listings published on Commrty as of September 2026 and describe listed inventory, not the entire market. Analysis is generated from those figures and refreshed monthly.
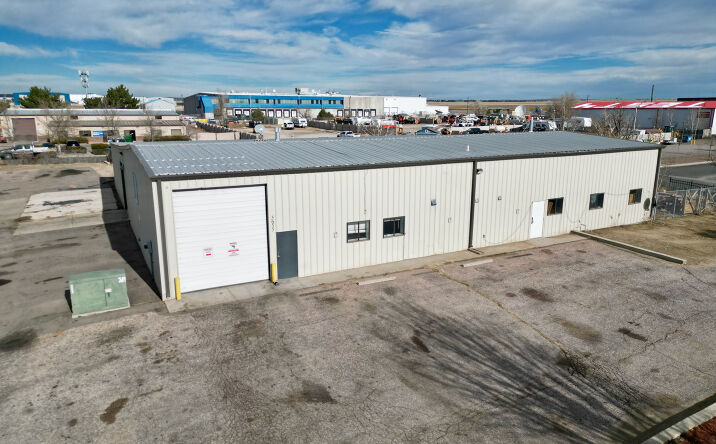
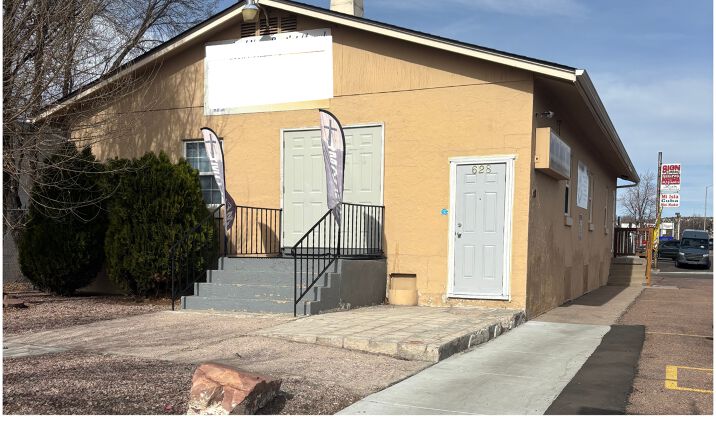
Featured Colorado Springs listings
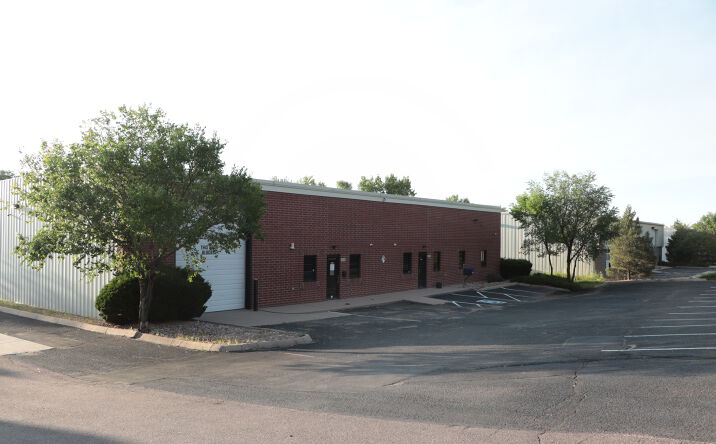 📍
📍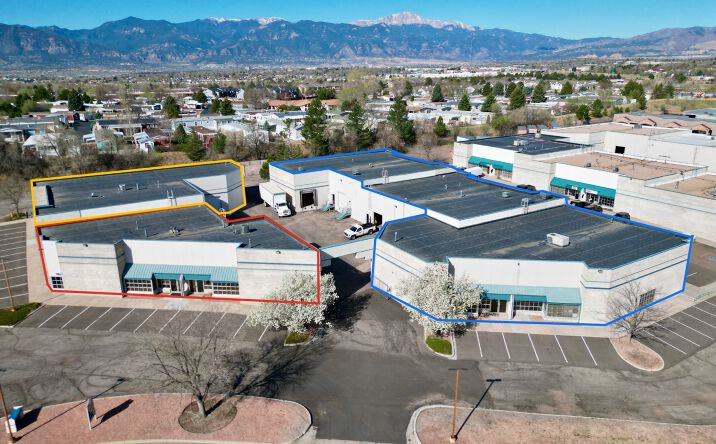 📍
📍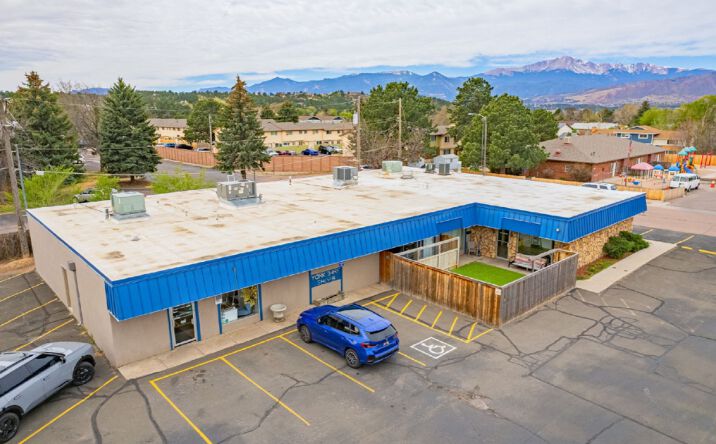 📍
📍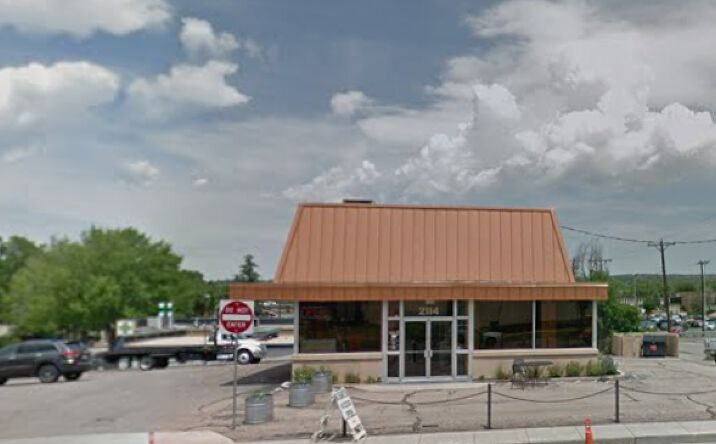 📍
📍 📍
📍 📍
📍